
Application performance can make the difference between retaining or losing customers, with delays beyond a few seconds leading to dropped conversions. Performance testing and monitoring are vital for improving the overall user experience, achieving a competitive advantage, enhancing resource efficiency, enabling scalability, and reducing costs. Testing assesses an app’s stability, speed, scalability, and responsiveness; monitoring tracks real-time metrics to ensure your app exceeds expectations in service performance and creates a positive user experience. In both testing and monitoring, throughput is an important output metric to track because it gauges application effectiveness and readiness. In this article, you’ll learn the essentials of application performance best practices, focusing on testing, monitoring, and throughput. You’ll explore how tracking your app’s performance helps improve your overall user experience, competitive advantage, resource efficiency, scalability, and cost savings. You’ll discover effective ways to measure performance, including key metrics and tools for identifying bottlenecks, and see some common causes of poor performance.
Why Is Keeping Track of Your App’s Performance Important?
With users expecting quick, reliable, and efficient interactions, your app’s performance directly influences their experience and your app’s overall reputation. It’s not just about functionality; it’s about delivering that functionality swiftly and smoothly. Tracking and optimizing overall app performance is crucial for several reasons:
- Better user experience: 70 percent of users abandon slow-loading apps; monitoring performance ensures your app stays fast and responsive.
- Competitive advantage: Performance monitoring helps you maintain a competitive edge by ensuring your app is responsive and reliable, preventing user churn and building brand loyalty.
- Resource efficiency: Tracking responsiveness, data usage, and battery consumption ensures efficient resource usage, enhancing user experience and building cost-effective, dependable apps.
- Scalability: Performance tracking ensures your app can handle growth and increased traffic without sacrificing efficiency or stability, optimizing infrastructure for high demand.
- Cost reduction: Optimizing performance during app development reduces the need for extensive post-launch modifications and scalability efforts, lowering long-term expenses.
Common Causes of Bad Performance in Web Apps
Before getting into how to diagnose and address performance issues, let’s take a look at some common causes of poor app performance:
- Network issues: Web app performance can suffer in suboptimal network conditions. For instance, a streaming service might experience buffering or low-quality streams during periods of high network latency or limited bandwidth.
- Server issues: Server-side problems like overloaded servers, inefficient server-side processing, or inadequate server resources can cause slow response times and downtime. For example, an e-commerce website might experience server overload during Black Friday sales, resulting in slow response times and even downtime.
- Inefficient code: Poorly written or unoptimized code can lead to various performance issues, including bloated scripts, excessive DOM manipulations, and inefficient algorithms, which can slow down app processing and responsiveness.
- Client issues: On the client side, issues such as heavy use of client-side scripts, unoptimized images and assets, and overuse of plugins can adversely affect app performance.
How Can You Measure Your App’s Performance Efficiently?
Regular testing and monitoring are essential to identify and improve overall app performance. Start by defining and tracking essential Key Performance Indicators (KPIs) such as load times and error rates. These app performance metrics will help you establish benchmarks, pinpoint bottlenecks, and guide optimizations. Continuous, real-time tracking with analytics tools help to detect performance trends and inform decision-making. Profiling and tracing tools offer insights into code performance, resource usage, and execution flow. They identify bottlenecks by analyzing CPU usage, detecting memory leaks, and monitoring I/O operations. Combining these tools with database performance analyzers helps optimize interactions and enhance app efficiency. Regular use ensures targeted code optimizations, improving the overall user experience. You can also implement Real User Monitoring (RUM), synthetic monitoring, and load testing to gain a comprehensive performance overview. RUM captures real-time data on user interactions, while synthetic monitoring simulates user behavior in controlled environments to identify potential issues before they impact users. Load testing evaluates application performance under high traffic, ensuring it can handle peak loads. Together, these methods provide a complete performance overview, enabling efficient measurement and app optimization for a seamless user experience.
Top Five Ways to Improve Your App’s Performance
So far, you’ve learned about the significance of testing and monitoring performance, some common causes of performance issues, and the key areas for monitoring. Now, let’s explore the top five ways you can actually enhance your app’s performance.
Implement Continuous Performance Testing
Performance testing produces valuable data that can help you ensure your app meets and exceeds user satisfaction. However, for this data to be useful, you need to collect it regularly. You cannot run a battery of performance tests once and rely on that data for an extended period of time; ongoing software development is likely to change the performance profile of your application. The following techniques can help mitigate this issue and ensure your data is up to date:
- Routine testing schedule: Integrate performance testing into your CI/CD pipeline and run tests regularly (for example, on release candidates, nightly or weekly builds).
- Realistic test scenarios: Devise realistic test scenarios by simulating various network conditions, user loads, and user journeys to ensure your app performs well in real-world and ideal conditions.
- Repeatability and consistency: Ensure tests are repeatable under the same conditions by using a dedicated testing environment that mirrors production. Use consistent inputs and traffic patterns to improve measurement accuracy and assess the impact of code changes.
- Leverage advanced tools: Use advanced performance monitoring tools like Speedscale to replicate real-world traffic, maintain stable environments, and ensure consistent backend responses for reliable results.
- Result analysis: Thoroughly analyze test results to identify bottlenecks and improvement opportunities. Use insights to guide performance optimization decisions and refine the testing process continuously.
[caption id=“attachment_16629” align=“aligncenter” width=“800”]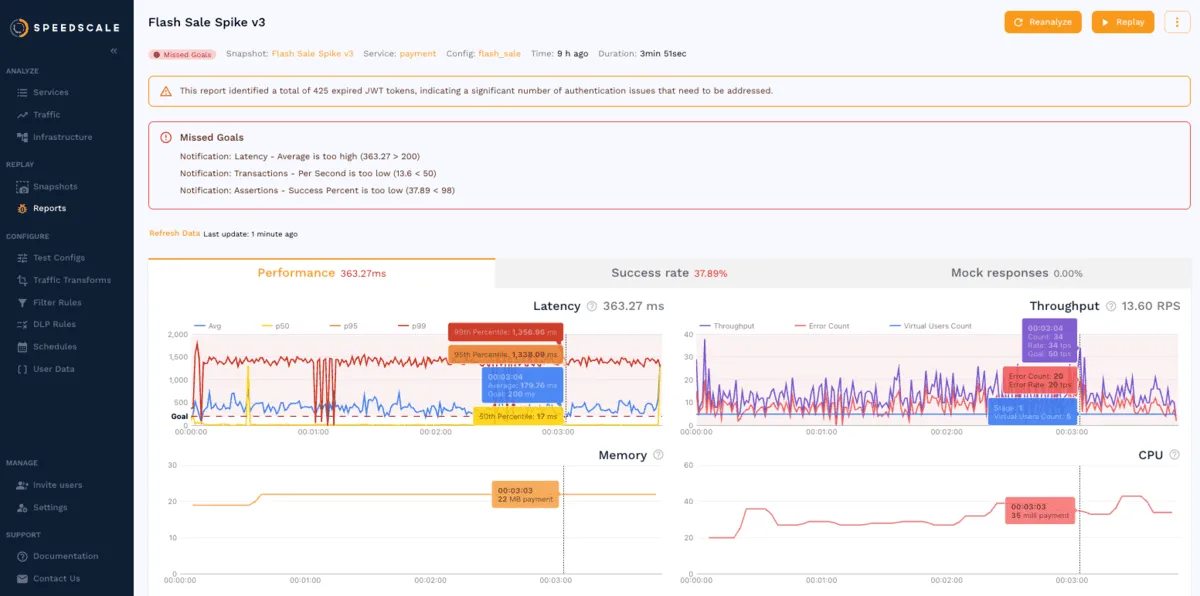 Speedscale’s Reports show how an app would perform against realistic traffic with key performance metrics, like latency, throughput, memory usage, and CPU.[/caption] Read more about: A Developer’s Guide to Continuous Performance Testing
Implement Caching and CDNs
Some performance issues may stem from poorly optimized asset delivery. Modern web apps rely on a multitude of relatively large assets, such as images, CSS, and fonts. Serving content closer to the user can reduce latency when delivering such assets. If you don’t have optimizations in place for the delivery of these assets, here are some methods you can try for an immediate, material performance improvement:
- Client-side caching: If a user has already downloaded assets, they generally don’t need to download them again until there is a new version. Use browser caching by setting appropriate cache control headers to avoid having the user re-download redundant assets.
- Server-side caching: Similarly, you may have compute-heavy calculations on the backend that will produce the same result unless their inputs have changed. These are good candidates for server-side caching using something like Redis or Memcached.
- API response caching: You may have some endpoints that are frequently called and seldom change. In this case, you can take server-side caching a step further and cache the entire API response for these endpoints. This reduces the load on the server and improves overall server performance and response times for the user.
- Utilize CDNs: To reduce download latency for static assets like CSS files, images, and fonts, serve these files from a geographic location closer to the user. CDNs host multiple copies of your assets across several geographically dispersed servers for this purpose. As an added bonus, this further reduces the load on your servers, as they won’t have to serve static assets.
- Leverage edge computing: Some CDN providers also offer edge computing capabilities, which allow you to run serverless functions close to your users. If you run serverless functions as part of your architecture, this can be an effective way to reduce latency further by running logic closer to the user, decreasing round-trip time.
Compress Data Before Delivering
Implementing caching and CDNs can optimize the delivery of assets to your users, and you can further reduce latency and performance impact by optimizing the content itself. Here are some strategies you can try:
- Compress files: Compress files and assets before sending them over the network. For CSS and JavaScript, you can use tools like CSSNano and UglifyJS, respectively, to reduce the size of the files before you serve them. Before sending, you can compress data with Gzip or Brotli to further reduce the data sent over the wire.
- Optimized image formats: Using efficient image formats like WebP can result in lossless images that are 26% smaller than comparable PNGs, saving bandwidth without impacting quality.
- Code optimization and bundling: Unoptimized JavaScript bundles can be quite large and contain a lot of redundant code. You can mitigate this with bundlers like Webpack or Rollup that can help you reduce your bundle size through techniques like tree shaking and code splitting.
- Font optimization: If your site uses custom fonts, make sure they are delivered in an efficient format like WOFF2. If you are aiming to maximize your optimizations, you can also consider subsetting your fonts to remove any unused characters, further reducing the font’s size.
- HTTP/2 and HTTP/3: It’s worth checking which HTTP protocol versions your site supports. If you haven’t already done so, you can take advantage of HTTP/2 and HTTP/3 to reduce your site’s latency and improve parallelism
Reduce Network Calls
Optimizing network calls is a critical factor in achieving optimal app performance. Additional network requests have the potential to slow down your application, which is especially pertinent in mobile app environments where network performance conditions are less predictable. To mitigate the cost of excessive network calls, you can try the following tactics:
- Aggregate resource requests: If you have multiple CSS and JavaScript files, rather than making one request per file, you can utilize a bundler like Webpack or Rollup to combine the files together, decreasing the number of HTTP requests made.
- Optimize API endpoints: Similarly, with your API calls, you can optimize the response payloads to deliver comprehensive data in a single call rather than fragmenting data across multiple calls. This cuts down on network traffic and helps ensure efficient data retrieval. GraphQL is an implementation that does this quite well, allowing the frontend to compose whatever data it needs in a single request.
- Leverage cache-first strategies: If you have data that doesn’t change often but is read frequently, like user settings or feature flags, consider storing these values in IndexedDB or localstorage and reading them from there. This can allow your pages to respond quicker using the pre-stored value, which can then be updated in the background without hindering user engagement.
- Use persistent connections: Consider utilizing persistent connections to reduce the overhead of establishing new connections
Optimize Database Interactions and Other Transactions
Inefficient database operations can be one of the most prolific causes of performance issues. It’s very easy to inadvertently create a poorly optimized query or table, and they can have a terrible performance impact. The following tips may help if you’re facing database-related issues:
- Identify slow queries: Use query analysis tools like pt-query-digest or pgBadger to identify and catalog slow queries.
- Optimize database queries: Start by optimizing your identified slow queries. Use tools like query optimizers and explain plan statements to refine your queries. Also, make sure you have appropriate indexing to avoid full table scans.
- Optimize data models: Consider optimizing your data models by striking a balance between normalization to reduce data redundancy and denormalization to simplify complex queries. This optimization should align with your app’s unique data usage patterns and requirements.
- Transaction management: Aim to keep database transactions short and minimize locking, as this can lead to unwanted delays in query processing.
- Database caching: Consider implementing caching for frequently accessed data, as this can significantly cut down on the volume of database queries, leading to improved response times.
- Read replicas: If your application is read-heavy or geographically distributed, you can implement read replicas to distribute the load.
- Database connection pooling: Similar to using persistent HTTP connections, you can employ connection pooling to reuse database connections, thus avoiding the overhead of constantly creating new connections.
- Framework-specific guidance: If you’re using a framework or ORM library, make sure you follow best practices for database performance for that library or framework. Consider cases like Laravel’s Eloquent ORM’s eager loading capability, where a single line of code can be the difference between “N+1” and drastically faster constant-time query performance. Performance best practices will vary depending on the tools and libraries you are using, so be sure to check.
Conclusion
Navigating app performance requires technical expertise, strategic foresight, and continual improvement. This article provided an overview of enhancing app performance, emphasizing the crucial aspects of user experience, efficiency, scalability, and cost-effectiveness. From understanding the importance of application performance monitoring and testing to diving into actionable strategies like active performance testing, caching, data compression, minimizing network calls, and database optimization, this guide covered a comprehensive spectrum of techniques to elevate your app’s performance.