A Guide to Kubernetes Visibility: Best Practices and Tools
Kubernetes (k8s) is becoming the go-to solution for managing containerized applications. Effectively managing and understanding what happens within a Kubernetes cluster— referred to as “Kubernetes visibility”— is crucial for optimizing application performance and security.
This guide explores what Kubernetes infrastructure visibility and Kubernetes traffic visibility mean, why they matter, the challenges involved, and the best practices surrounding them. This guide also discusses different visibility tools and observability tools offered to maximize your Kubernetes system.
What does Kubernetes visibility mean?
Kubernetes visibility refers to the ability to monitor and understand the state and behavior of all aspects of a Kubernetes environment. This includes underlying infrastructure as well as application traffic.
Infrastructure visibility
Because Kubernetes works as an orchestration layer under your applications, in addition to the typical application visibility you’d expect to monitor, there are also Kubernetes infrastructure specific items to observe about your Kubernetes cluster. This includes real time insights into the Kubernetes control plane, Kubernetes workloads, Kubernetes services, networking, and storage.
Traffic Visibility
Understanding traffic is crucial for any application. You likely have dozens of Kubernetes services all in different containers, which increases the complexity of understanding each Kubernetes service in isolation. Analyzing the individual inbound and outbound requests for each service is invaluable for insights into your Kubernetes system.
How does Kubernetes visibility improve performance?
Visibility into your Kubernetes deployment can improve performance in several aspects:
- Proactive Monitoring: Continuously monitoring pods, nodes, and services helps teams detect and address potential issues before they impact application performance metrics.
- Resource Allocation: Visibility tools provide detailed insights into resource usage. This allows teams to optimize container resources like CPU usage and memory usage for cost management.
- Faster Troubleshooting: With comprehensive visibility, it becomes easier to pinpoint the root causes of issues. Detailed logs, metrics, and events guide developers in resolving problems quickly.
Kubernetes Monitoring: Top 5 Tools & Methodologies
Why is Kubernetes visibility difficult?
However, achieving full visibility in Kubernetes can be extra challenging. For starters this is because:
- Complexity of Architecture: Kubernetes environments are highly dynamic and distributed. There are also differences between your own application versus Kubernetes overhead such as Kubernetes worker nodes or the Kubernetes control plane. This makes it difficult to track every component’s interaction and performance.
- Scale: Large Kubernetes clusters can run hundreds of containers, making it hard to monitor each one individually.
- Transient Behaviors: Containers and pods in Kubernetes can be short-lived. Capturing data from these ephemeral resources before they disappear is a complex task.
Why do we need 3rd party tools for Kubernetes visibility?
While vanilla Kubernetes offers basic monitoring tools via the Kubernetes API (this powers tools like kubectl and the Kubernetes dashboard), these are often insufficient for comprehensive visibility. Additional tools are used for:
- Extended Capabilities: Specialized tools can capture more detailed data and provide advanced analytics for Kubernetes observability. They are built on top of the Kubernetes API server to help teams better understand their Kubernetes environment.
- Easier team workflows: Vanilla tools like kubectl and the Kubernetes dashboard could be difficult or insecure to access within your organization, depending on how your entire cluster is deployed.
Infrastructure visibility
What aspects of your Kubernetes cluster are important to collect and analyze? A typical application will work with the following:
Workloads
Workloads are the applications deployed on Kubernetes. There are different kinds of Kubernetes Workloads— the most common is a Kubernetes Deployment, but there are also ReplicaSet, StatefulSet, DaemonSet, or Job. With workloads, it’s important to track the performance and health of applications. Key metrics include CPU usage, memory usage, and network I/O.
Services
Workloads by themselves don’t have IP addresses for the outside world. To expose an application on single outward-facing endpoint, a Kubernetes service is used. Visibility into Kubernetes services helps ensure that the network traffic directed to these services is behaving as expected. Monitoring success rates, response times, and traffic volumes can help in optimizing performance and security configurations.
Configuration
Like all applications, Kubernetes applications need to be configured. In Kubernetes, tools like a Kubernetes ConfigMap or Kubernetes Secret are used to pass information into your applications as environment variables or command-line arguments. Configuration visibility is crucial for building context to understanding your k8s environment.
Events
Kubernetes events provide a timeline of what has happened in the cluster, such as pod lifecycle events, scheduler actions, and error messages. Monitoring these events helps in understanding the system’s behavior and troubleshooting issues.
Infrastructure visibility tools
Some of the various popular tools people use for Kubernetes infrastructure visibility include the following:
Kubernetes dashboard
The Kubernetes Dashboard is a web-based GUI for Kubernetes clusters. It allows users to manage and troubleshoot applications as well as the cluster itself, offering a detailed overview of your k8s environment.
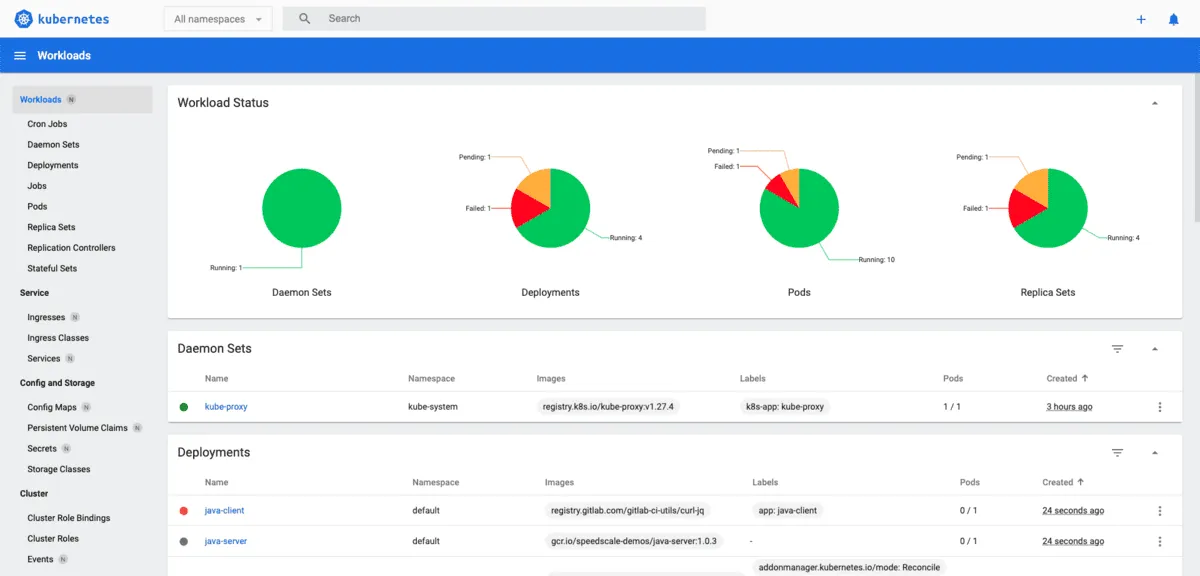
However, the dashboard is designed only for basic functionality so it’s fairly limited. Advanced features like multi cluster views are not supported. So adding a new cluster would require a new dashboard instance. The Kubernetes dashboard also has essentially no support for viewing traffic.
Although the Kubernetes dashboard is served as a website, it is typically used only locally. Full fledged SaaS products are typically used for Kubernetes visibility that have proper security and hosting measures.
k9s
k9s is a terminal-based UI to interact with your Kubernetes clusters. It simplifies navigating clusters and managing resources, making it easier to monitor the health and performance of deployments. It feels like a nice, interactive kubectl wrapper.
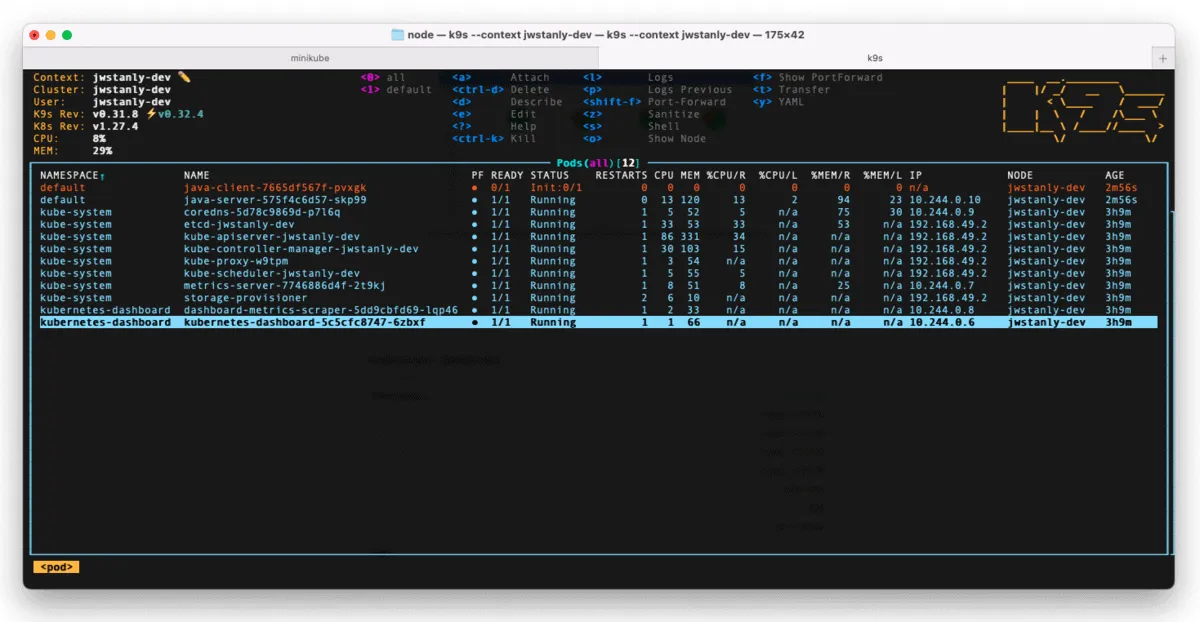
k9s has the same shortcomings as the Kubernetes dashboard— it’s bare bones, and access inside your organization may be difficult. k9s is great for tech savvy people who can navigate the terminal (and Vim key bindings), but doesn’t help people who won’t grasp its TUI. Access directly into a cluster may not be possible at your organization either.
KubeSphere
KubeSphere is an open source management platform that enhances Kubernetes’ native capabilities. KubeSphere is designed to control all your Kubernetes processes, such as managing CI/CD with Jenkins, integration with an app store, and helping with service mesh for microservices.

Therefore, KubeSphere is way more comprehensive than standalone observability tools like the k8s dashboard or k9s. This could be a blessing or a curse. If you’re starting fresh with Kubernetes and looking for an opinionated way of running your clusters, KubeSphere is a helpful all-in-one tool (which happens to include visibility). On the other hand, if you’re already running Kubernetes clusters, adding KubeSphere just for visibility could be overkill.
Lens
Lens is a desktop SaaS application for Kubernetes cluster management. Its intuitive GUI provides real-time visibility into cluster operations, making it easier for developers to manage applications effectively.
Lens offers a rich infrastructure view which covers all aspects of your cluster. However, it runs locally as a native desktop app. This can run into the same access issues within your organization. If your visibility tool should be accessed online, Lens might not be a fit.
Speedscale
Speedscale is a Kubernetes SaaS tool that’s centered around your traffic. Speedscale offers a visibility tool on their web app and cli tool speedctl.
Unlike other visibility tools which access your Kubernetes cluster directly, Speedscale runs data collection through a Kubernetes operator. This means Speedscale’s web app offers visibility features which can be accessed remotely. Speedscale’s infrastructure page shows all needed aspects of your cluster like configurations, workloads, secrets, services, and events.
Speedscale also offers Kubernetes traffic visibility, an entire field of visibility other Kubernetes infrastructure visibility tools don’t support.
Traffic visibility
Traffic inspection tools offer immense visibility. Although large observability platforms like Datadog or New Relic offer aggregated data from traces, these tools don’t inspect individual requests well.
A tool that captures this network data is a great addition to your observability toolset.
Traffic visibility tools
Some of the various popular tools people use for Kubernetes traffic visibility include the following:
Speedscale
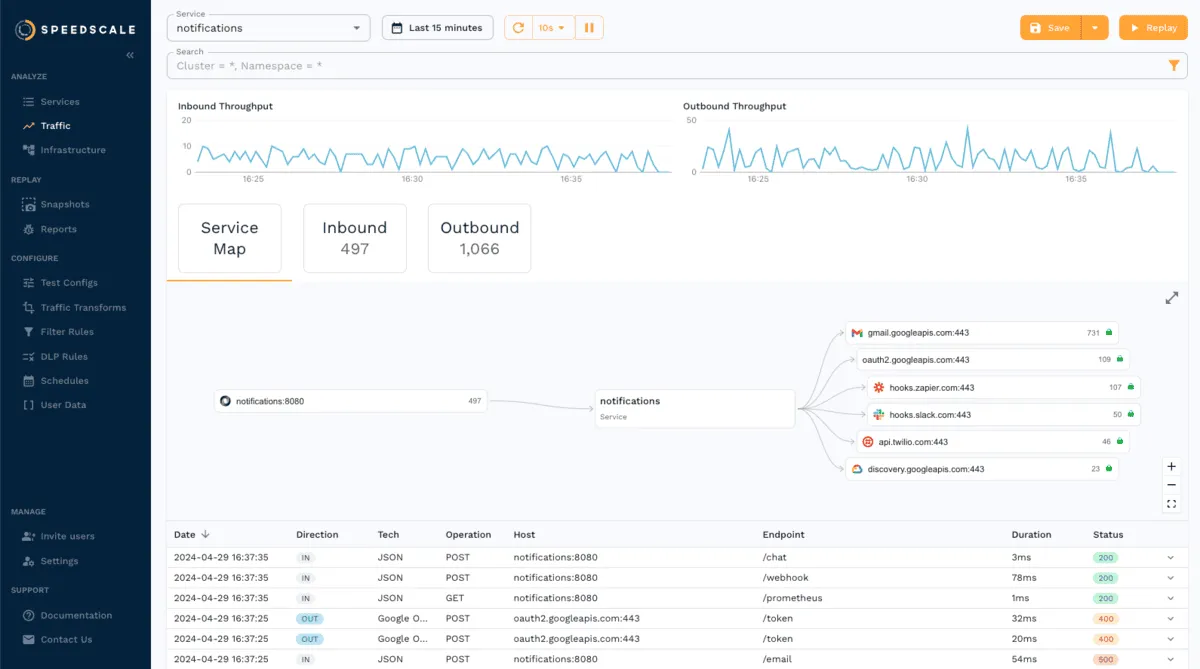
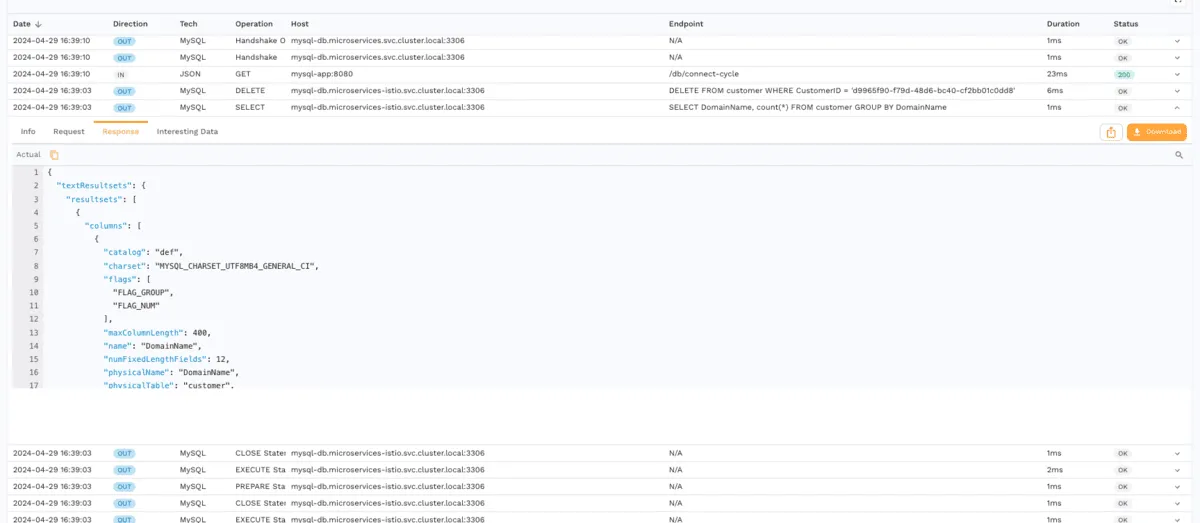
Speedscale shows a Kubernetes service’s traffic and displays stats on every individual request. Speedscale automatically runs proxies to decrypt TLS traffic into human readable formats. Speedscale also decodes common tech like Postgres, MySQL, gRPC, and others.
Speedscale analyzes requests to build a visual service map to highlight the mesh between services. Speedscale also has rich filters to extract specific requests.
Each request response pair can be expanded to view body lines, headers, cookies, JWT info and more.
Speedscale uses recorded traffic for other features too. One is “traffic replay”, where previously recorded traffic can be re-ran through any Kubernetes service. Traffic replay can create realistic load tests for invaluable performance data. Traffic replay is also invaluable for regression tests when building a new feature or migrating to a new cluster.
The Complete Traffic Replay Tutorial
Kubeshark
Another traffic visualization tool is Kubeshark, an open source project with SaaS offerings. Kubeshark uses eBPF to collect traffic within your Kubernetes system. Like Wireshark, Kubeshark spits out tons of network traffic including low level DNS traffic. Kubeshark also decrypts TLS traffic and decodes popular tech like Postgres, MySQL, and gRPC.
Kubeshark is great for using traffic for visualization, but it doesn’t have testing features like traffic replay for getting performance metrics.
Conclusion
Kubernetes visibility is crucial for any cluster. As Kubernetes continues to evolve, staying abreast of new tools and techniques is key to achieving optimal visibility.