Speedscale is proud to announce its Centralized Log Collection capability. When diagnosing the source of problems in your API, more information is better. For most engineers, the diagnosis process usually starts with the application logs. Unfortunately, logs are usually either discarded or stored in Observability systems that engineers don’t have direct access to. Compounding this issue is that the log information is typically not correlated to what calls were made against the API. When the API is running in a test environment the problem becomes even worse because these environments usually aren’t monitored.

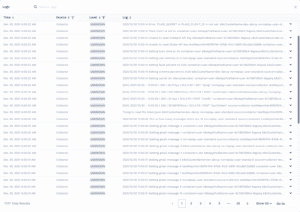
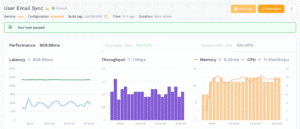
To solve this problem, Speedscale has developed a Centralized Log Collector capability. Whenever a traffic replay or test is triggered by Speedscale, the Log Collector automatically captures the logs and makes them available in the context of the replay report. This capability requires no agents and no configuration. Just run your Kubernetes-based replay as usual and the application logs will appear in the report under View Logs.
How is this different from a monitoring tool?
Monitoring tools are designed to always be on. Speedscale’s Log Collector is currently only activated during a traffic replay. Today, it is not designed to be left on in the Kubernetes cluster.
Also, Speedscale automatically correlates the application logs with the metrics and other test report data. Manual copy/paste of log information is not required.
Use cases
Understanding application behavior with Speedscale keeps getting easier!
- Understand exactly how your application behaves during the replay
- Log messages from all containers are time-stamped so that individual API calls from the Speedscale generator can be correlated to specific application logs
- Compare application log output over time and in different scenarios
About Speedscale
Many businesses struggle to discover problems with their cloud services before they impact customers. For developers, writing tests is manual and time-intensive. Speedscale helps Kubernetes engineering teams gain confidence in how new code will perform in real world scenarios. Speedscale can collect and replay API traffic, simulate load or chaos, and measure latency, throughput, saturation and errors before the code is released. Speedscale Traffic Replay is an alternative to legacy testing approaches which take days or weeks to run and do not scale well for modern architectures. If you would like to try it out, sign up for a free trial today!
