As APIs become more complex, it can be easy to accidentally break connections. To prevent this, Speedscale can automatically detect and make you aware of inbound and outbound transactions running through APIs in our API Dependency Graph. The Traffic Viewer dashboard makes this information visible to independent teams working on different services. In most organizations this information is usually only known by senior engineers, team leads, and architects. In other companies, this type of data is manually maintained in spreadsheets.
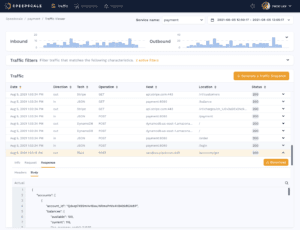
From the Traffic Viewer (Fig 1), capturing a snapshot of this traffic will generate a graphical representation of downstream dependencies (including 3rd party services) your API needs in order to respond to requests. As a developer, understanding your API’s dependencies sounds like basic knowledge. But with time, employee turnover, and time-constrained documentation, things can quickly get lost.

Why an API Dependency Graph?
It is often surprising and insightful for Speedscale users to see configuration and code at runtime in actual service-to-service calls. By examining dependencies, headers, messages, and associated metrics, users can get a realtime look at what makes their API tick. Backend services — both internal and 3rd party, are critical to the operation of your API. Unpredictable, error prone 3rd party APIs are a top reason for production outages and can cause major headaches.
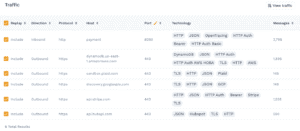
That is why the Speedscale framework automatically transforms all inbound traffic into functional/performance test suites to exercise your service. Outbound traffic is analyzed and categorized by endpoint. Each endpoint’s behavior is then distilled down to a service mock that can be provisioned as a container. (Fig 2)

Use cases
Once your dependencies are automatically identified and mocked based on actual traffic, faster development and testing can begin!
- Understand exactly how clients call your API, and how to configure the headers and messages yourself
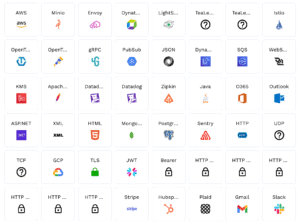
- Automatically detect the technologies used by the microservice (Fig 3)
- Run tests more often, while avoiding the delays and complexity of provisioning large, slow, end-to-end environments.
- Stable, repeatable environments with consistent service mocks also allow for regular testing with predictable backend behavior. (Nylas was able to improve API performance 30x due to performant 3rd party mocks that allowed them to iteratively test, tune, improve, and re-test regularly, without impacting prod).
- Simulate backend chaos behavior whenever you need it. Slow down, speed up, or simulate non-responsiveness in your 3rd party connections. No amount of conventional testing covers this sort of negative/destructive testing!

How is this different than other monitoring tools?
Tools like DataDog and AppDynamics show you what your application topology or dependencies are, and provide metrics around those connections. For Speedscale, the API Dependency Graph is a means to an end. By showing you the inbound and outbound traffic and capturing messages with hi-fidelity, this data can be used to generate tests and mocks. Most monitoring tools will show you URLs, destinations, metrics and performance. Speedscale is focused on what is inside the transactions, such as header details, message bodies, and parameters. Automatically comparing these type of details allows Speedscale’s test automation to truly keep up with microservice release cycles.
About Speedscale
Many businesses struggle to discover problems with their cloud services before they impact customers. For developers, writing tests is manual and time-intensive. Speedscale helps Kubernetes engineering teams gain confidence in how new code will perform in real world scenarios. Speedscale can collect and replay API traffic, simulate load or chaos, and measure latency, throughput, saturation and errors before the code is released. Speedscale Traffic Replay is an alternative to legacy testing approaches which take days or weeks to run and do not scale well for modern architectures. If you would like to try it out, sign up for a free trial today!