Kubernetes is an incredibly powerful solution, but testing the Kubernetes Ingress resources themselves can prove to be quite tricky. This can lead to significant frustration for developers - bugs can pop up in production that weren’t caught during testing, workflows that make sense on paper might fail in practice, and so forth.
Why Ingress Testing Fails - Misalignment and Data?
These faults can happen for a large variety of reasons, ranging from simple ingress rules mismatches to more complex issues with load balancers or web servers. With ingress specifically, the problem often has to do with a fundamental misalignment between the data being used in testing and the traffic that is generated in production. The most well-defined rules will fail in these environments, especially if the appropriate services are aligned to a specific data type or content flow.
Tools like Postman have been adopted as a way of generating traffic that is more useful for testing. While Postman and tools like it can be a great way of generating traffic, they have a fundamental drawback - the data is manually created, and as such, often reflects the biases and assumptions of the generator.
Not only is this approach likely to introduce issues in the generated traffic, it’s likely to also miss needed variations for single endpoints, such as differential headers, request bodies, and so forth. For a tool like Postman, it’s almost impossible to create all the needed variations for all possible endpoints.
More Accurate Data Through Traffic Replay
While you can get pretty far with manually generated traffic, it’s unreasonable to think that these processes could ever fully replicate what’s happening in production. Internal services often work in complex ways, and the realities of the combinations of your inbound services, the multiple paths of data flow, the exact path for a given type of data, and even subtle differences between elements such as the cloud providers or the server/external load balancer can introduce a certain amount of chaos that simply can’t be modeled.
Given the importance of testing your ingress path for your Kubernetes installation, what’s the best process? One possible solution is to use traffic replay. Traffic replay is a great method to create a traffic source that can be used as a methodology for emulating the realities of production, ensuring that the constituent parts of your Kubernetes deploy replicates the realities of production.
This data has many other uses beyond this purpose, including load generation, scaling tests, advanced traffic management, and much more - for this reason, traffic replay should be considered a tool rather than an end-all-be-all solution.
Let’s take a look at how traffic replay can be used as one of the most effective - and one of the few nearly complete - methodologies to test Kubernetes ingress. To do this, we’ll utilize Speedscale to capture traffic.
Prerequisites for Testing Kubernetes Ingress With Product
ion Traffic
There are a few prerequisites you will have to meet to follow the steps outlined in this post.
First, this post will use Minikube to set up a cluster and interact with it, and will include some Minikube-specific steps. However, if you are familiar enough with Kubernetes, you can also run your own cluster in any way you prefer.

Second, you will need to install Speedscale. If you’re unfamiliar with Speedscale and how it works, it’s recommended that you first check out this tutorial on how Speedscale works in general. However, simple instructions will be given later in this post.

While the steps in this post are specific to Speedscale and Minikube, the principles of using traffic replay for Ingress testing remain the same, no matter what combination of tools you use.
As such, a read-through of this post without following the steps should still allow you to garner a good understanding of how traffic replay can help you test Ingress in Kubernetes in general.
Ingress Configuration
As you’ll be testing Ingress resources in this post, you will need to enable the Ingress Controller. Ingress controllers manage external access to an API object or collection of services, controlling the flow of incoming traffic - as such, this is a key part of this process:
minikube addons enable ingress
If you are using a cluster other than Minikube, follow the installation instructions for Nginx that are relevant for you.
You’ll also have to enable the metrics-server, as it is used by Speedscale:
minikube addons enable metrics-server
For clusters other than Minikube, enabling metrics-server is highly individual depending on your provider. You can verify if metrics-server is already enabled with kubectl get deploy,svc -n kube-system | egrep metrics-server.
Configuring Sample Service
Now you’ll have to set up a sample service that can receive traffic, which in this case will be Speedscale’s fork of podtato-head. To do this, start by cloning the repo and changing directory into the cloned directory:
git clone https://github.com/speedscale/podtato-head && cd podtato-headNow you can go ahead and deploy podtato-head by using the kubectl apply -f command:
kubectl apply -f delivery/kubectl/manifest.yaml
Verify that the Pods are running by using the kubectl get pods command. If any Pods are still in the ContainerCreating, wait a minute or so until your output resembles what you see below.
kubectl get pods
Once all Pods are running, you can verify that the application works as expected. podtato-head receives traffic on port 31000 on the podtato-head-entry service. So to test the application, forward port 31000 to any unprivileged port, for example port 8080:
kubectl port-forward svc/podtato-head-entry 8080
Now open up your browser to localhost:8080 and you should see the following:

Enable the Tunnel in Minikube
At this point, you now have a running application in your cluster that is capable of receiving traffic. But, you want to make this accessible through an Ingress instead of using port-forward. To do this, you first have to enable a tunnel in Minikube. This tunnel will provide you with an IP address that you can use to send requests to the Ingress Controller in your cluster.
minikube tunnel
Note that the IP will be different when using Docker Desktop compared to Docker Engine. For Docker Desktop users, you will have to send requests to localhost. Docker Engine users, on the other hand, will have to send requests to the IP output by the minikube tunnel command (most commonly 192.168.49.2). From here on, 192.168.49.2 will be used as the example IP.
At this point, you can verify the tunnel by sending a request to the minikube IP. Make sure to use another terminal window, as the one used for the minikube tunnel command has to stay open:
curl 192.168.49.2
Getting a 404 error is completely normal here, since you’ve yet to configure any backend for the controller. So, let’s do that now! Save the following to a file named ingress.yaml:
apiVersion: networking.k8s.io/v1
kind: Ingress
metadata:
  name: podtato-head-ingress # name of Ingress resource
  annotations:
    nginx.ingress.kubernetes.io/rewrite-target: /$1
spec:
  rules:
    - host: podtato-head.info # hostname to use for podtato-head connections
      http:
        paths:
          - path: / # route all url paths to this Ingress resource
            pathType: Prefix
            backend:
              service:
                name: podtato-head-entry # service to forward requests to
                port:
                  number: 31000 # port to use
This will deploy an Ingress resource to forward requests to your podtato-head application. Deploy it by using the kubectl apply command:
kubectl apply -f ingress.yaml
Now wait until the Ingress resource has been assigned an address:
kubectl get ingress
At this point, you should be able to access podtato-head through the Ingress resource, which you can verify with curl:
curl -H "Host: podtato-head.info" 192.168.49.2If you’re not familiar with the -H "Host: podtato-head.info" part of this curl command, this is a way to specify the Host header, which is what the Ingress Controller uses for its matching algorithm, subsequently determining where to forward the request.
You’ll notice that this matches line 9 in the ingress.yaml file.
At this point, the sample application should be working, and you can start to capture traffic.
Capturing Traffic With Speedscale
To capture traffic with Speedscale, you first need to sign up for a free account. From here you can enter the Speedscale WebUI, where you’ll find a quick start guide. For simplicity’s sake, here are the instructions you’ll need.
First, install the speedctl tool with Homebrew:
brew install speedscale/tap/speedctl
Now, initialize the speedctl tool. To do this you’ll need your API key, which you can find in the quick start guide in the Speedscale WebUI.
speedctl init
At this point, you’re done configuring the speedctl tool, and you can now install the Speedscale Operator in your cluster using the speedctl install command.
speedctl install
Follow the instructions in the wizard for the installation. Assuming the install was successful, Speedscale will now capture any traffic sent to the podtato-head application. To generate traffic, use the following while loop to send a request every half second. Let this run for at least a minute or so.
while true; do curl podtato-head.info; sleep 0.5; doneBy opening the service in Speedscale’s traffic viewer, you should be able to see the requests being captured.
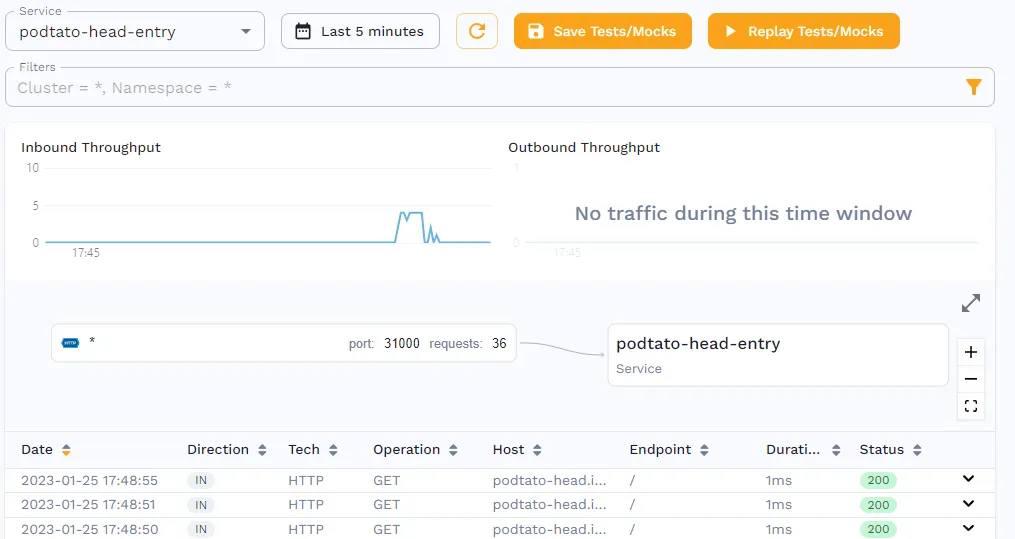
To use this traffic, save it as a snapshot, by clicking the “Save Tests/Mocks” button, which should bring you to the following page.
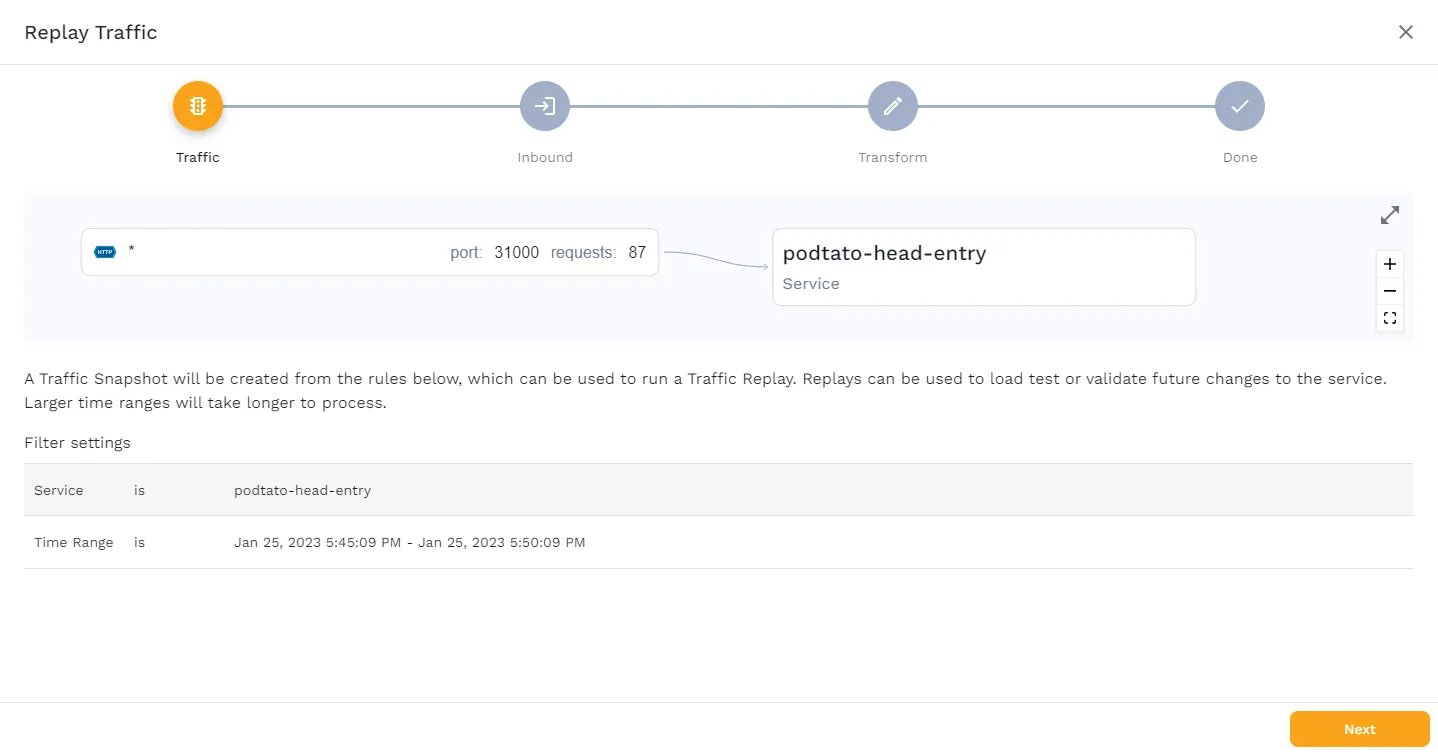
This page shows you what Service is being used, and how the traffic flows. Click “Next” to see the following screen.
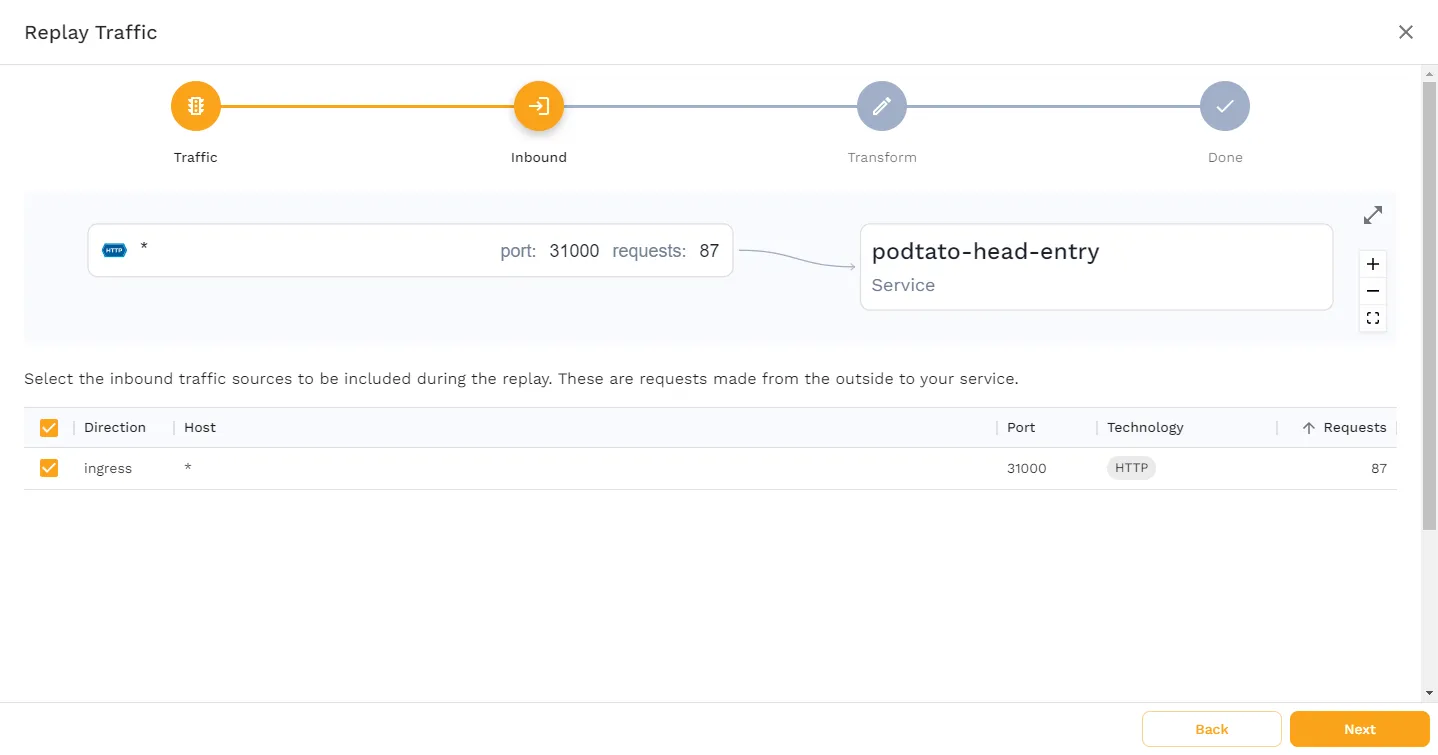
This page shows you what traffic Speedscale has captured. In this case, only incoming requests to port 31000 have been captured, which is exactly what we would expect. Click “Next”.
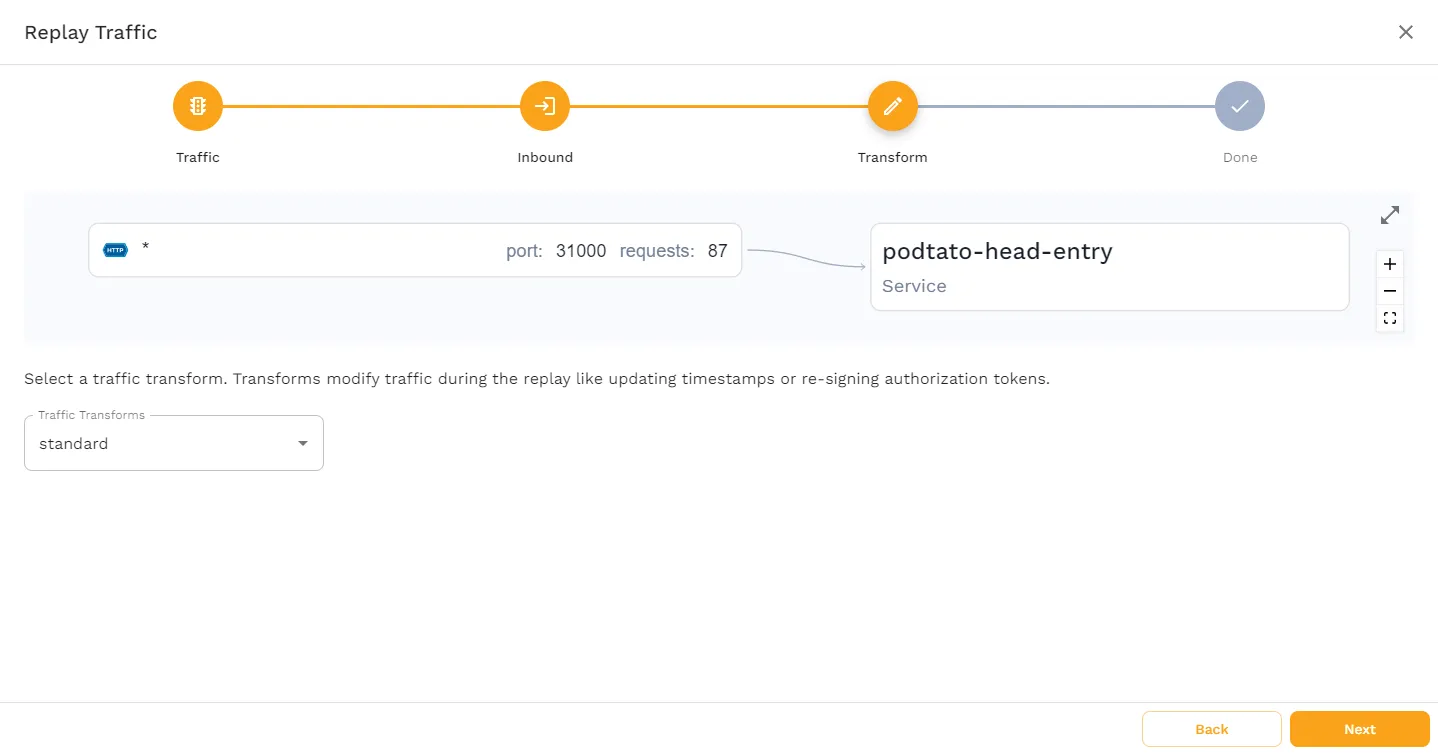
On this page, you’re able to choose any Transforms you may want applied to the traffic. This tutorial only requires the standard transform, so go ahead and click “Next”.
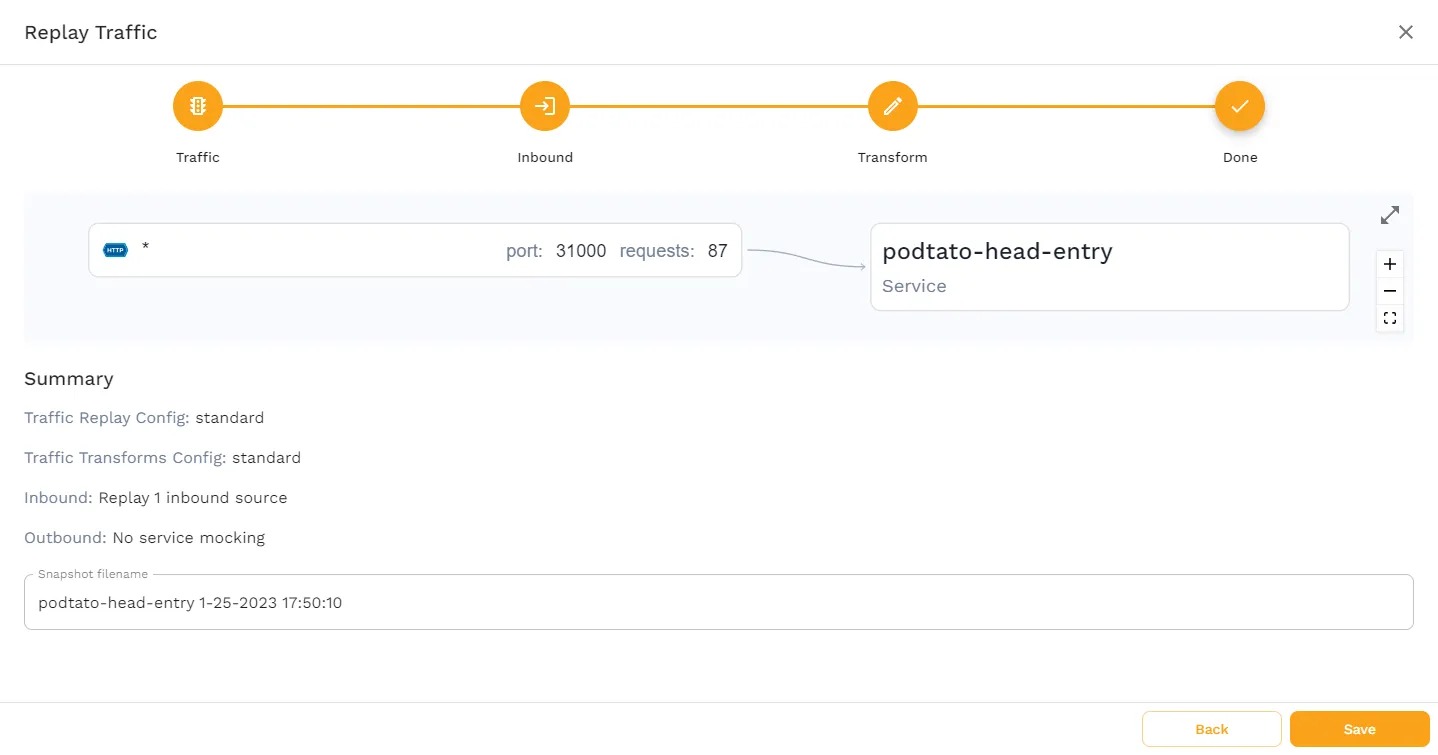
This last page gives you a summary of how you’ve configured the snapshot, and allows you to change the name of the snapshot. No changes are needed here, so click “Save” to finish the snapshot creation.
At this point, you’ve got a running application, and a snapshot containing the traffic that’s been sent to it. Now it’s time to see how you can test your Ingress by replaying the traffic.
Testing Ingress
First, you should verify that the snapshot works as expected. To do this you’ll need to grab the snapshot-id. Click on the Snapshots tab in the left-hand menu, then click on your snapshot, and you’ll find the snapshot-id in the URL.
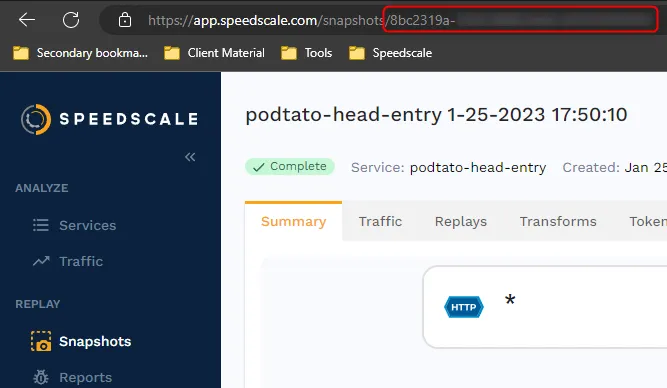
To replay the traffic you can either use the WebUI, or you can initiate it with the speedctl CLI tool. To use the CLI tool, run the following command:
speedctl infra replay --test-config-id standard \
    --cluster minikube \
    --snapshot-id <snapshot-id> \
    -n ingress-nginx \
    ingress-nginx-controller
Make sure to replace the <snapshot-id> with your own id. The last two lines of this command are specifying the namespace ingres-nginx and the Service ingress-nginx-controller. If you’re replaying the snapshot through the WebUI, it’s important to make sure that this is the chosen Service, as Speedscale also allows you to replay the traffic directly to the podtato-head-entry Service, which would circumvent the Ingress resource and make this test useless.
After a few seconds, the command should output a new id, which is the id of the report. You can now check this report to make sure the replay was successful.
Note that the following command uses jq to parse the json output of the speedctl analyze report command. Make sure to install this tool; for example, by running brew install jq.
speedctl analyze report <report-id> | jqYou may experience an output message stating that the report is still being analyzed, in which case you’ll just have to wait a bit and try again. Because of the low traffic, this shouldn’t take more than a minute.
Once the report is done being analyzed, you should see the output "Passed". This verifies that the replay fulfills the assertions set by the standard config, which essentially states that the traffic returned during the replay should match the captured traffic.
Now it’s finally time to see how Speedscale can help you test the Ingress resource. There are many different ways Speedscale can help you test Ingress:
- Verify response times
- Verify number of requests to certain endpoints
- Verify performance, i.e., transactions per second
And many more. In this case, you’ll simulate a scenario where your Ingress resource is failing. Do this by deleting it with the kubectl delete command.
$ kubectl delete -f ingress.yamlNow you can replay the snapshot again.
speedctl infra replay --test-config-id standard \
    --cluster minikube \
    --snapshot-id <snapshot-id> \
    -n ingress-nginx \
    ingress-nginx-controller
This will output a new id, which you can then analyze:
speedctl analyze report f4f7a973-3457-4586-b316-2f6a6d671c62 | jq ‘.status’ “Missed Goals”
This time you’ll see that the output is showing "Missed Goals", indicating that something went wrong. If you open the report in the WebUI, you’ll see that this was caused by 404 responses. This is exactly as expected, as the Ingress Controller no longer knows where to send the traffic.
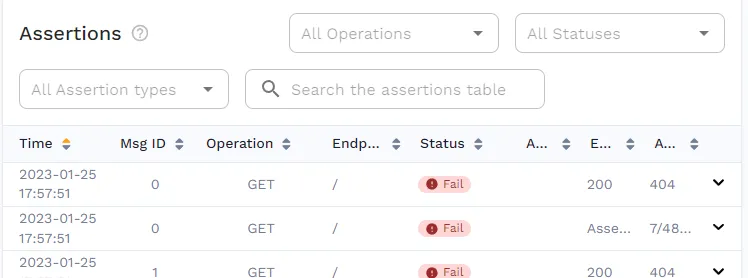
This is also a great example of how snapshot replays can be implemented in CI/CD pipelines, as it’s easy to perform a simple check on the output of the speedctl analyze report command.
Is Traffic Replay the Optimal Approach?
In this post, you’ve seen just a simple example of how traffic replay can help you test your Ingress resources, but this is only the tip of the iceberg.
Traffic Replay is Reusable
Here, you’ve seen an example of traffic being replayed within the same cluster; however, Speedscale allows you to replay traffic anywhere that the Operator is installed. This means you can easily capture traffic in your production environment and replay it in staging or development. This also means you can test across multiple Kubernetes clusters or Kubernetes services, utilizing the same network traffic to do everything from adjusting your load-balancing algorithm to experimenting with new ingress classes.
Fresh Data is Useful Data
This approach not only allows you to use realistic data when testing new configuration changes (thereby increasing the validity of testing), but it also makes it easy to use up-to-date and relevant data. This freshness of data is of particular importance when you are testing new iterations of your data flow.
How can you know whether you are routing to the appropriate internal services if you don’t know what data is realistically being seen in production? How can you adjust a network load balancer if you don’t know what the network is doing? The freshness of this data will be paramount in ensuring you have an accurate projection of the network, and thereby can make the appropriate decisions.
Considerations of Data Privacy
With the increasing focus on data regulations, such as GDPR, sharing data between production and development may concern you. However, with Speedscale’s focus on only storing desensitized, PII-redacted traffic, and with its single-tenant, SOC2 Type 2 certified architecture, you can be sure that any captured traffic is safe and compliant.

This is especially important when considering the management of data from multiple services or multiple ingress controllers. Data can often be very different even from timeframe to timeframe, and it’s hard to predict what data might be covered under GDPR or not given the flexibility users have in their interactions. Having high control over the traffic within the cluster, both in transit and at rest, will help you significantly in the process of ensuring regulatory compliance.
Test Iterations as Apples to Apples
There’s a commons saying that you should “compare apples to apples”, and that’s very much what you’re doing with this traffic process. Testing different solutions such as new traffic routing or managing traffic and inbound connections with different data is not as useful as you might think - without having a common set of data, you can’t compare “apples to apples”, as you don’t know how similar the traffic pattern is between collection periods.
This is especially true when trying to test new iterations across multiple load balancers that might be exposing multiple services or data flows. Without having a common data flow and method for routing traffic, you’re introducing substantial chaos into the process which might give you false impressions of the efficacy of your existing ingress or the novel solutions you’re trying to deploy.
Test Ingress, Not Symptoms
Using traffic replay is a great way to test your specific ingress points. This process is a hybrid between an art and a science - in many ways, ingress testing could be testing the symptoms of other parts of the collective rather than the specific elements of a given Kubernetes cluster or ingress point. This is especially true with complex ingress controller implementation or complex approaches from other technologies (such as Azure’s availability zones techniques). In essence, you want to test the actual ingress flow and process and not the symptoms of other parts.
Using traffic replay allows you to isolate parts and systems, testing actual elements. If you want to test the load balancer service or the virtual host ingress, you can isolate those pieces, and by using the same data between tests, you can be assured of the actual applicability of your testing regime. Variability in HTTPS routes, name-based virtual hosting, SSL termination, and ingress resource backend namespace transformation - each of these elements can cause symptomatic changes in your ingress testing. With replay data, however, you can isolate those elements effectively because you know what is from the data and what is from the service.
Conclusion
All in all, while there may likely be some use cases where traffic replay isn’t the optimal approach, there are many cases where it’s at least a valid consideration. If you’re still on the fence about traffic replay as a whole, you may want to check out the write-up on how traffic replay fits into production traffic replication as a whole.