Playwright End-to-End Testing with Recorded API Mocks
Your Playwright test clicks Next page, waits for the item list, and times out. Now you’re digging through a trace to find out whether the page broke or an API call failed.
Traditional browser-testing workflows focus on clicks, page state and UI assertions. Those checks tell you whether a user journey works, but investigating a failure also means understanding the APIs behind the page.
Speedscale brings browser testing and API testing into the same workflow. Record the API traffic behind a journey, replay it as mocks to test the frontend with the backend stopped, or compare real API responses with the recording. The report can flag API calls the recording couldn’t answer and, with response comparison enabled, responses that changed. You get the browser’s assertions, screenshots and traces alongside the API evidence needed to investigate the failure.
We’ll reproduce both failures, then change the backend and catch the response that broke the page. Along the way, you’ll run Playwright tests with the API stopped and move the same specs into Kubernetes. The announcement post explains why we built browser journeys; this is the walkthrough.
Everything below is in the browser journeys lab. The output excerpts come from a fresh clone using released images; filenames, timings and report ids will differ on your machine. The report screenshots come from dev.speedscale.com. Allow about ten minutes for the local steps. The cluster steps take longer, mostly while pulling images.
What you need
For the local steps: Node 22 or newer, make and proxymock v2.5.1274 or newer. Run proxymock init --api-key <key> once, with a free key. For the cluster steps, add minikube, kubectl and helm. The lab requests 4 CPUs and 6 GB of memory for minikube; those resources need to fit inside your Docker Desktop or Podman VM alongside any other running clusters. Leave disk space for the browser image too.
git clone https://github.com/speedscale/mock-lab.git
cd mock-lab/labs/browser-journeys
make install
make install puts @playwright/test and Chromium in the lab folder, where proxymock looks for them.
The app under test
The app is a one-page shop with two buttons, Load items and Next page. Both call http://api.localtest.me:8081/items with a custom header, which triggers a CORS preflight. The API has its own host because api.localtest.me resolves to 127.0.0.1. If your network blocks that DNS lookup, the lab README has the /etc/hosts entry you’ll need.
There’s one passing journey in journeys/:
import { test, expect } from '@playwright/test';

test('shopper loads the item list', async ({ page }) => {
  await page.goto('/');
  await expect(page.getByRole('heading', { name: 'Demo shop SPA' })).toBeVisible();

  await test.step('load the item list', async () => {
    await page.getByRole('button', { name: 'Load items' }).click();
    await expect(page.getByRole('listitem')).toHaveText(['apple', 'pear']);
  });
});
The spec uses ordinary Playwright locators, steps and assertions. You can bring your existing specs too.
Step 1: record a journey
make record saves API traffic in proxymock/my-recording. This walkthrough uses that directory throughout the remaining steps. The lab also ships a bundled recording; there’s a fallback below if you want to skip the recording step.
Use three terminals for the local walkthrough. In each cd command, replace /path/to/mock-lab with the location of your clone. Run the remaining steps from this lab directory too.
Terminal 1: start the frontend. Leave it running through step 4.
cd /path/to/mock-lab/labs/browser-journeys
make site
Terminal 2: start the API. You’ll stop and restart processes in this terminal as the walkthrough changes modes.
cd /path/to/mock-lab/labs/browser-journeys
make api
Terminal 3: record a journey. Once recording finishes, use this terminal for the replay commands.
cd /path/to/mock-lab/labs/browser-journeys
make record
make record runs proxymock record --browser http://localhost:3000, which opens the shop in a Chromium window and records your actions with Playwright. In that window, click Load items once and wait for apple and pear to appear. Leave Next page alone: we’ll use that unrecorded call to cause a failure in step 3.
While you’re clicking, terminal 3 shows proxy startup messages and stays busy. To finish recording, close the shop’s Chromium window and wait for make record to return to the prompt. If another recorder window remains open, close that too. Keep the frontend and API running in terminals 1 and 2.
The following is completion output in terminal 3, after recording ends. It names the saved Playwright spec and suggests commands for replaying your recording. The lab script then lists the folders it kept:
recorded journey: proxymock/my-recording/journeys/recorded-2026-11-02_18-25-04.spec.ts
replay it against the frontend with its API calls answered from this recording:
  proxymock mock --in proxymock/my-recording
  proxymock replay --in proxymock/my-recording --browser proxymock/my-recording/journeys --test-against http://localhost:3000 --browser-proxy http://localhost:4140

kept in proxymock/my-recording:
api.localtest.me
journeys
localhost-3000
Before continuing, confirm that the journey and API recording directories contain files. Run these in terminal 3:
ls proxymock/my-recording/journeys
ls proxymock/my-recording/api.localtest.me
The remaining commands use RECORDING=proxymock/my-recording or --in proxymock/my-recording explicitly. The Makefile defaults to the bundled proxymock/recording if you omit that override, so keep it on the commands below.
Chromium sends background traffic to hosts such as accounts.google.com and clients2.google.com. The proxy records those calls alongside your API traffic. The lab’s make record removes them afterwards. When recording your own frontend, check for unrelated hosts before replaying.
The spec generated by this click has no assertion about the items. It can pass even if the API returns the wrong data:
import { test, expect } from '@playwright/test';

test('test', async ({ page }) => {
  await page.goto('/');
  await page.getByRole('button', { name: 'Load items' }).click();
});
Add an expectation such as the item-list check in journeys/items.spec.ts, or use Playwright’s assertion controls while recording.
The walkthrough uses the lab’s prepared specs in journeys/, which already contain those assertions, against the API responses you just recorded. The generated spec under proxymock/my-recording/journeys/ is separate; the completion output above shows how to replay that spec instead.
If you skip recording: on a fresh clone where proxymock/my-recording doesn’t exist, copy the bundled recording into the directory used by the commands below:
cp -R proxymock/recording proxymock/my-recordingStep 2: replay Playwright tests with the API switched off
In terminal 2, press Ctrl+C to stop make api. Port 8081 should now have nothing listening. Keep the frontend running in terminal 1, then start the mock server in terminal 2:
make mock RECORDING=proxymock/my-recordingThat runs proxymock mock --in proxymock/my-recording --no-passthrough. The flag makes a call the recording can’t answer get a 404 instead of going to the real host. Leave it running. In terminal 3, run the journey:
proxymock replay --in proxymock/my-recording --browser journeys \
  --test-against http://localhost:3000 --browser-proxy http://localhost:4140 \
  --out proxymock/results/journeys
The command finishes with a summary like this:
  ✓ shopper loads the item list (items.spec.ts:3) 132ms

Browser journeys: 1 passed, 0 failed, 0 skipped
Web vitals (p95 across journeys): LCP 28ms, FCP 28ms, TTFB 14.9ms, CLS 0
The journey passes with no API running. --test-against sets the frontend URL that page.goto('/') resolves against. --browser-proxy routes the browser’s other traffic through the mock server, including the CORS preflight recorded in this lab.
Step 3: two failures that look the same
journeys-failing/ adds two journeys that fail on purpose. One looks for a Checkout button the page doesn’t have. The other clicks Next page, which asks for ?page=2, the call we left out of the recording.
With the frontend and mock server still running, run this in terminal 3:
make replay-failing RECORDING=proxymock/my-recordingThis run is supposed to fail. Expect one passing journey and two failed journeys:
  ✓ shopper loads the item list (items.spec.ts:3) 169ms
  ✗ shopper sees a checkout button (checkout.spec.ts:5) 3.179s
      Error: expect(locator).toBeVisible() failed
  ✗ shopper pages through the items (next-page.spec.ts:4) 3.139s
      Error: expect(locator).toHaveText(expected) failed
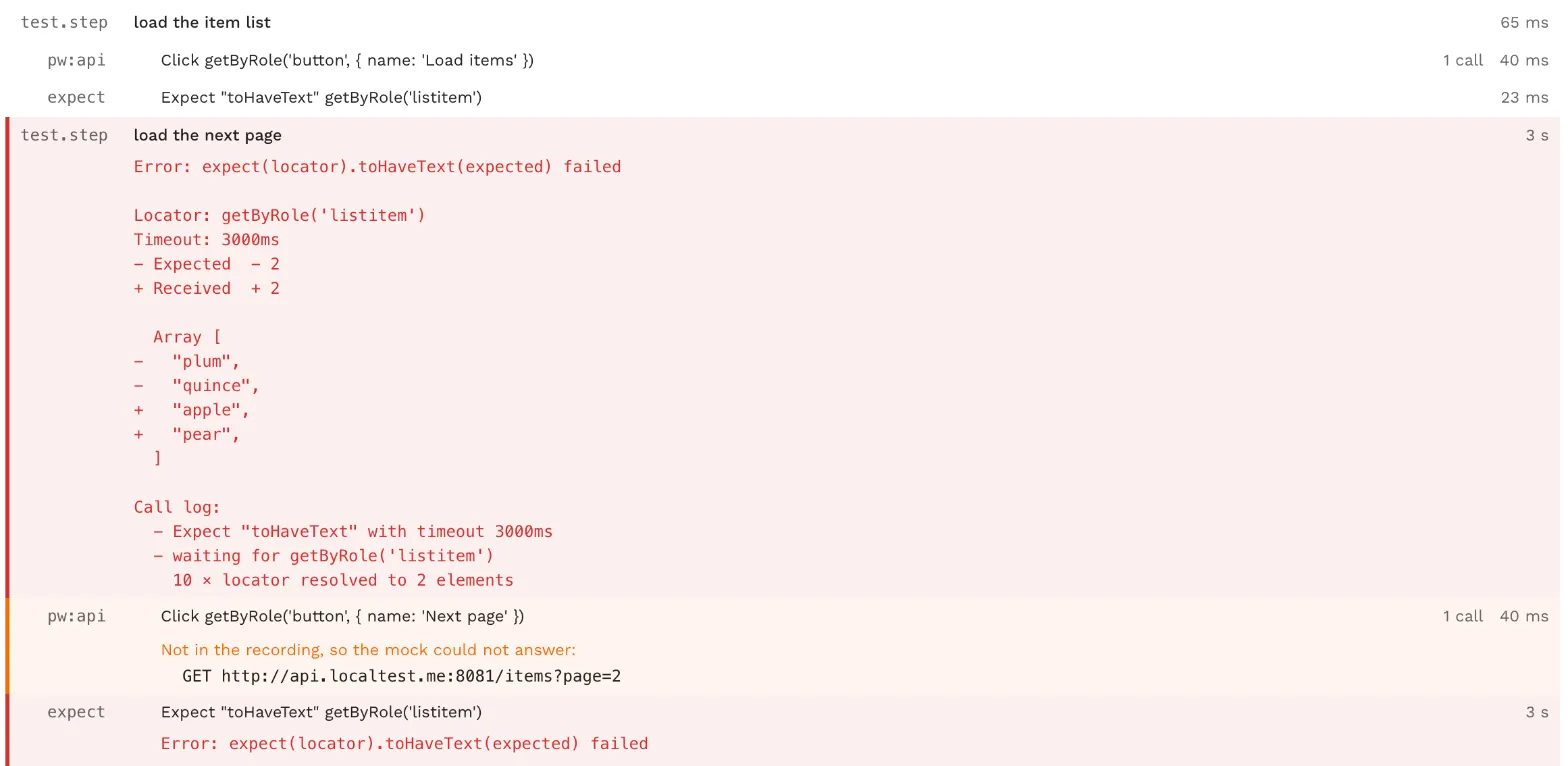
      not in the recording: GET http://api.localtest.me:8081/items?page=2

Browser journeys: 1 passed, 2 failed, 0 skipped
Both failures time out waiting for an expectation. In the Checkout test, the API calls were answered, but the page has no Checkout button. In the pagination test, the output names the missing call: GET /items?page=2. You can check whether the recording needs that call or the frontend made it by mistake.
No flagged call is a clue, not proof that the page is at fault. An aborted request can also go unflagged; the troubleshooting section below covers that case.
proxymock replay exits 1 when a journey fails; make replay-failing reports the target failure and exits 2. Both give CI a nonzero exit status.
Step 4: catch a backend change
Now send the calls to the real API and compare its responses with the recording. In terminal 2, stop make mock with Ctrl+C, then start the API again:
make apiOpen terminal 4, change to the lab directory, and start the mock server in observe mode. Leave the API and this server running:
cd /path/to/mock-lab/labs/browser-journeys
proxymock mock --in proxymock/my-recording --observe-real-apis
In terminal 3, run the journey. It should pass because the real API still matches the recording:
make replay RECORDING=proxymock/my-recordingNow make the backend change. In terminal 2, stop make api with Ctrl+C and restart it with ITEM_FIELD=title, which renames a response field:
ITEM_FIELD=title node app/api/server.jsRun the journey again in terminal 3:
make replay RECORDING=proxymock/my-recordingThe frontend didn’t change, but this run should fail and identify the changed API response:
  ✗ shopper loads the item list (items.spec.ts:3) 5.145s
      Error: expect(locator).toHaveText(expected) failed
      answered differently from the recording: GET http://api.localtest.me:8081/items (Body JSON)

Browser journeys: 0 passed, 1 failed, 0 skipped
The result names the endpoint and the part of its response that changed: the JSON body. The frontend still expects the old field.
Stop the foreground processes in terminals 1, 2 and 4 with Ctrl+C when you’re finished.
Step 5 (optional): rerun the lab in Kubernetes
The local walkthrough is complete. Continue with this step only if you want to rerun the lab in a Kubernetes cluster. Step 6 adds cloud reporting to that cluster run and is optional too.
Cluster replay is useful when you want to record in one environment and replay in another. Here, you’ll reuse the recording made locally and the same Playwright specs against the frontend deployed in Kubernetes. You can test the frontend in a different environment without recording its API traffic again.
Use terminal 3 for the cluster commands. make up creates a minikube profile called browser-journeys, installs the released Speedscale operator with no image overrides, and deploys the frontend and the API. Replace YOUR_API_KEY with the key for the same Speedscale account you initialized proxymock with:
export SPEEDSCALE_API_KEY='YOUR_API_KEY'
make up
Wait for the script’s lab is ready message before continuing. If you use a nondefault Speedscale dashboard, set SPEEDSCALE_APP_URL to its hostname before running make up, so the operator connects to the same account as proxymock.
minikube start moves your default kubectl context to the new profile; the script restores it when setup finishes. It also rewrites api.localtest.me in the cluster’s DNS to the shop-api Service, so there’s a real API to reach when mocks are off.
Run the same spec files in the cluster:
proxymock cluster replay start --kube-context browser-journeys \
  --target http://shop-spa.browser-journeys:80 --in proxymock/my-recording \
  --browser journeys --test-config config/browser-journeys-mocks.json --wait -o pretty
The first run can spend several minutes pulling the browser image. When it finishes, expect a passing result and both goals met:
  source:    local (staged in the in-cluster forwarder; no Speedscale cloud round-trip, report stays in the cluster)
  mocks:     the browser's API calls, by a responder in the generator pod
result: Passed (success rate 100.0%)
goals (0 of 2 missed):
  PASS browserLcpP95: expected <= 5,000, actual 24
  PASS browserJourneyPassPct: expected >= 100, actual 100
The recording and journeys are staged in the cluster’s forwarder, with no cloud round trip. The operator starts a browser pod with Chromium and a responder that answers the frontend’s API calls. shop-api is running, but this replay doesn’t call it. The responder uses the requesting origin in its CORS response, so the recording made on localhost:3000 also works against the cluster’s frontend.
Run the two broken journeys:
make cluster-failing RECORDING=proxymock/my-recordingThis failure is intentional. The command exits nonzero, lists the missed goals, and downloads each failed journey’s screenshot and trace:
result: Missed Goals (success rate 33.3%)
  FAIL browserJourneyPassPct: expected >= 100, actual 33.33
screenshots and traces of failed journeys, saved to browser-artifacts/<report id>:
Now send the API calls to the real shop-api. This target adds --no-mocks and should pass:
make cluster-real RECORDING=proxymock/my-recordingRename the response field in the cluster, then run the same journey again:
make change-api
make cluster-real RECORDING=proxymock/my-recording
The second run should fail. This cloud-free run checks the journey’s assertions but doesn’t compare API responses with the recording. Step 6 adds that comparison.
Step 6: read the report
Add --snapshot-source cloud to upload the snapshot and report to Speedscale cloud. Use the same Speedscale account for proxymock and the operator, then restore the API and run the failing journeys:
make restore-api
make cloud-failing RECORDING=proxymock/my-recording
The command prints a report at: link before cloud analysis has finished. For these cloud runs, --wait waits for the in-cluster replay and exits 0 even if a journey failed. The dashboard can still show Testing, with no Journeys tab, after the command returns. Wait for analysis to finish and the status to change to Passed or Missed Goals, then open Journeys. This took a couple of extra minutes in this run.
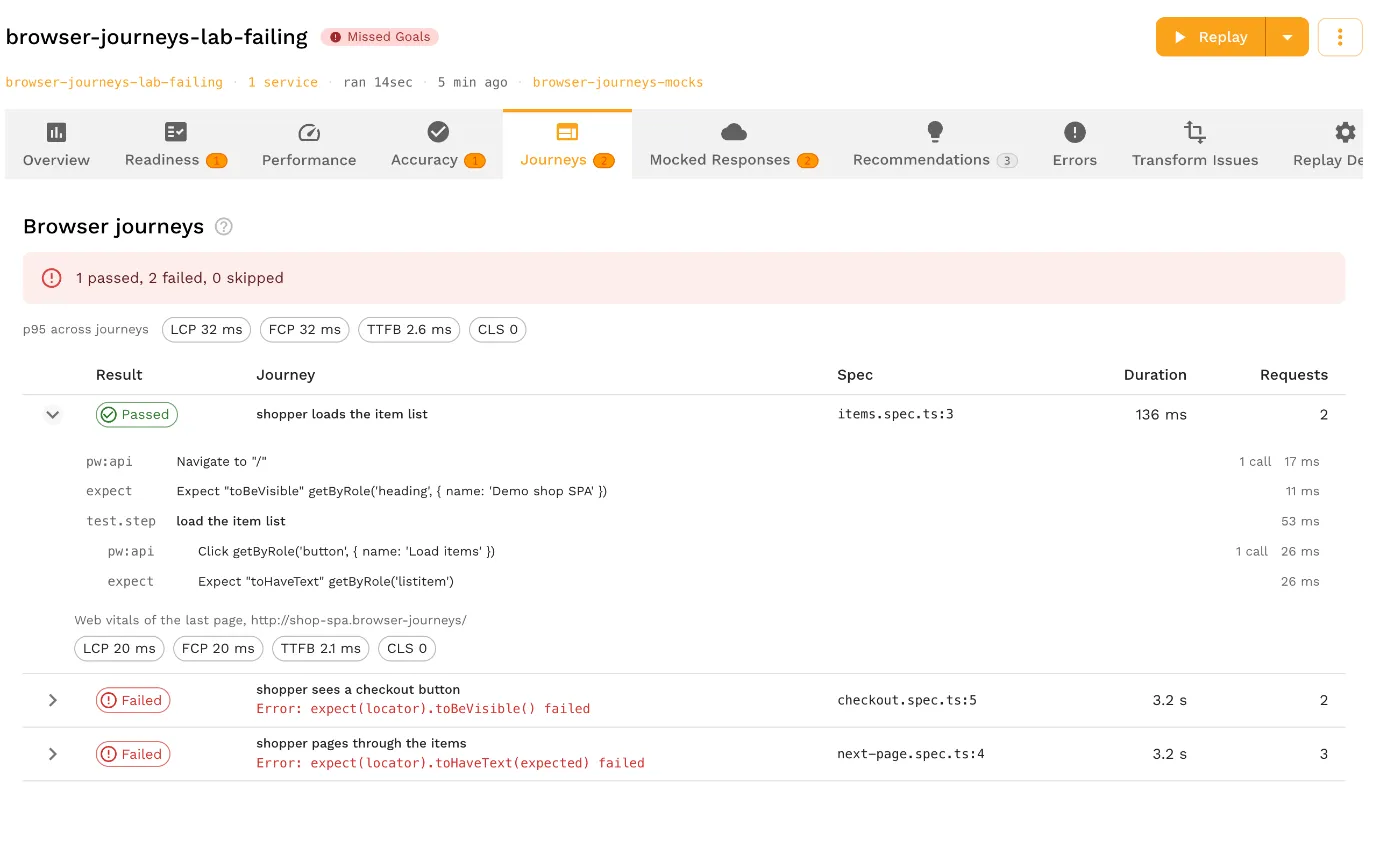
Expand shopper pages through the items. Each step lists how many calls it made. The click on Next page names the call the recording couldn’t answer, one step before the assertion times out.
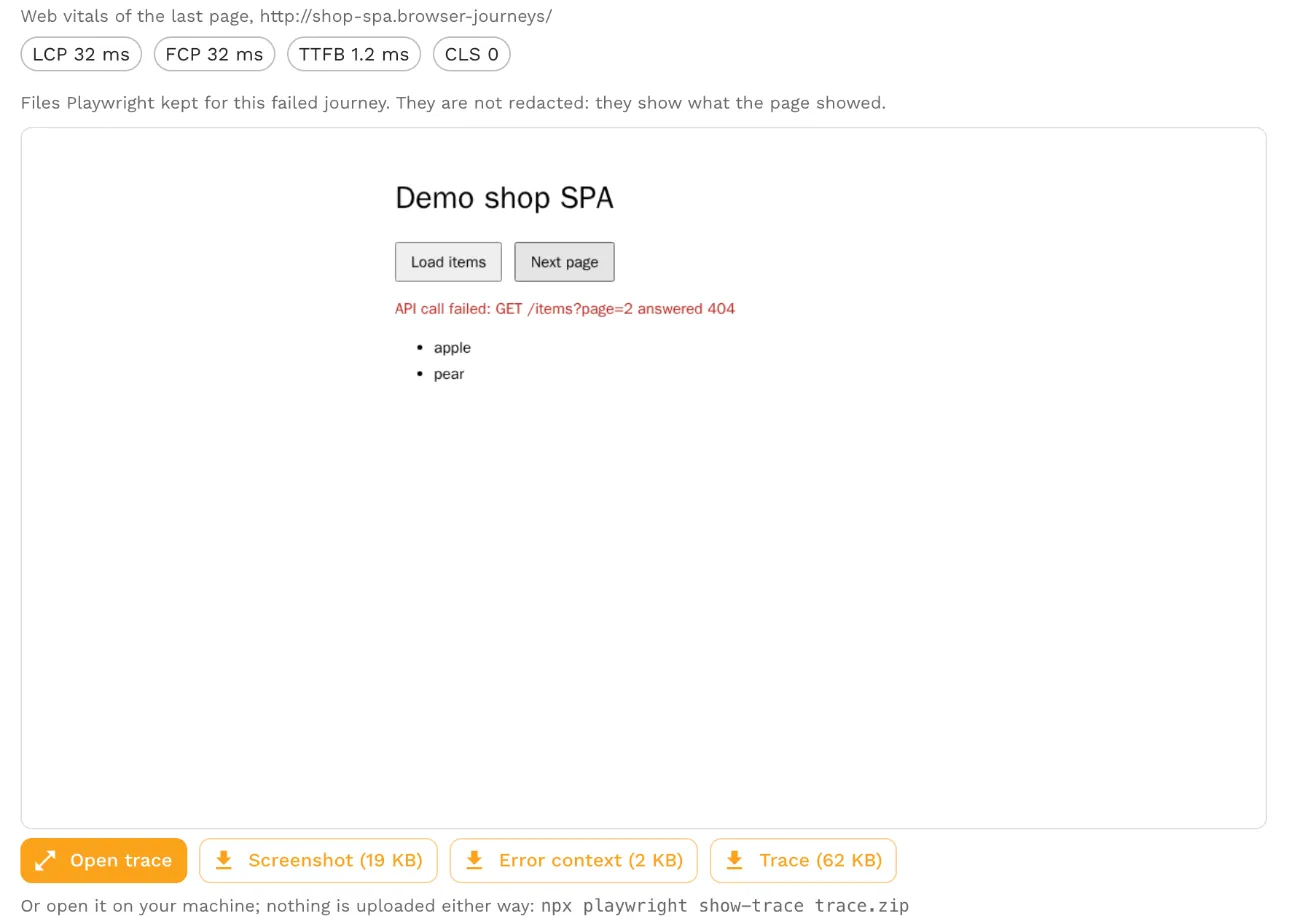
Below the steps, you’ll find the failure screenshot and files to download. The page says API call failed: GET /items?page=2 answered 404: the responder returned a 404, and the frontend displayed its error message.
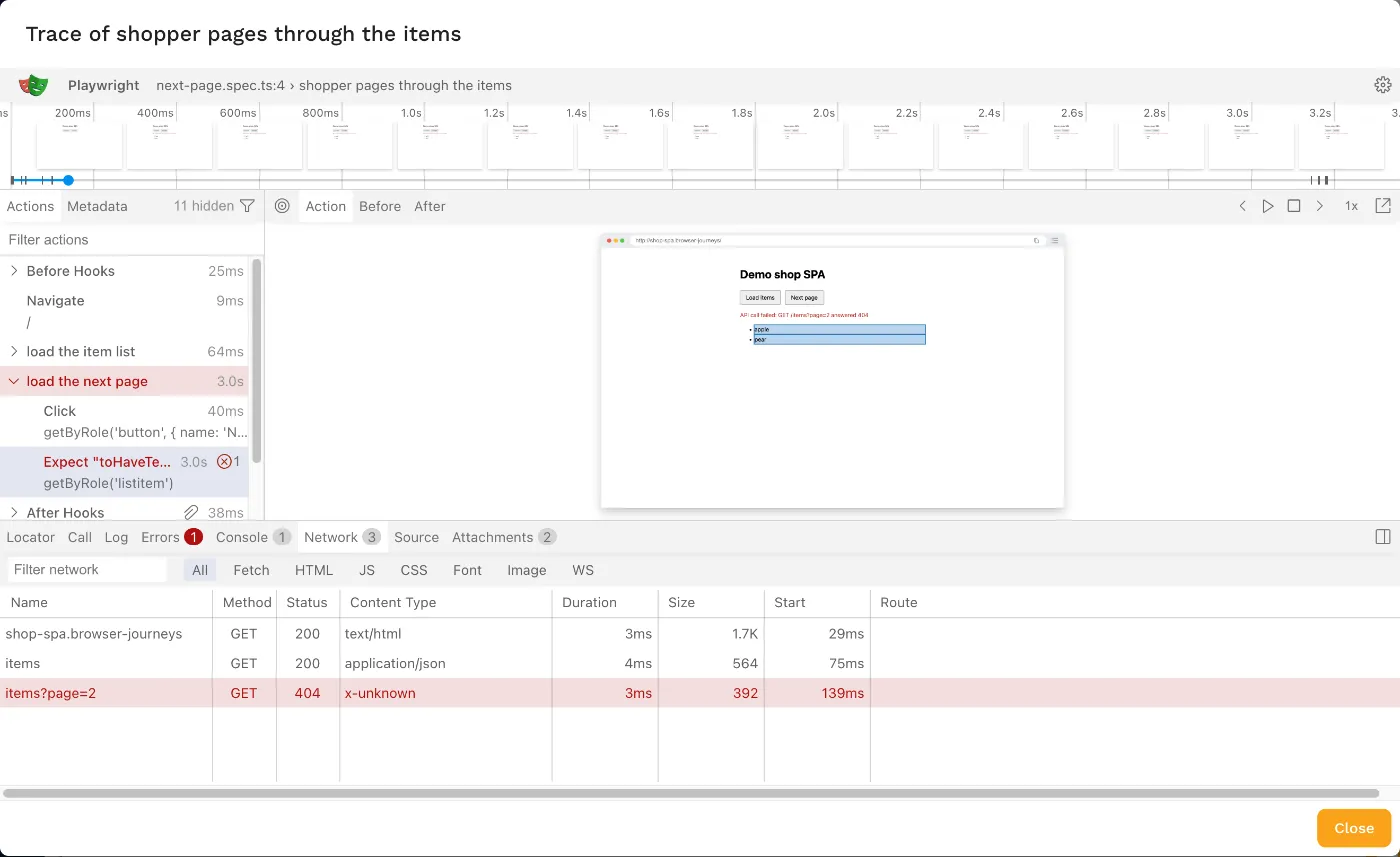
Select Open trace to inspect the run in Playwright’s trace viewer inside the dashboard. It shows the actions, page snapshots, console and network calls. The viewer reads the trace in your browser.
Now run the backend change with the comparison on:
make change-api
make cloud-real RECORDING=proxymock/my-recording
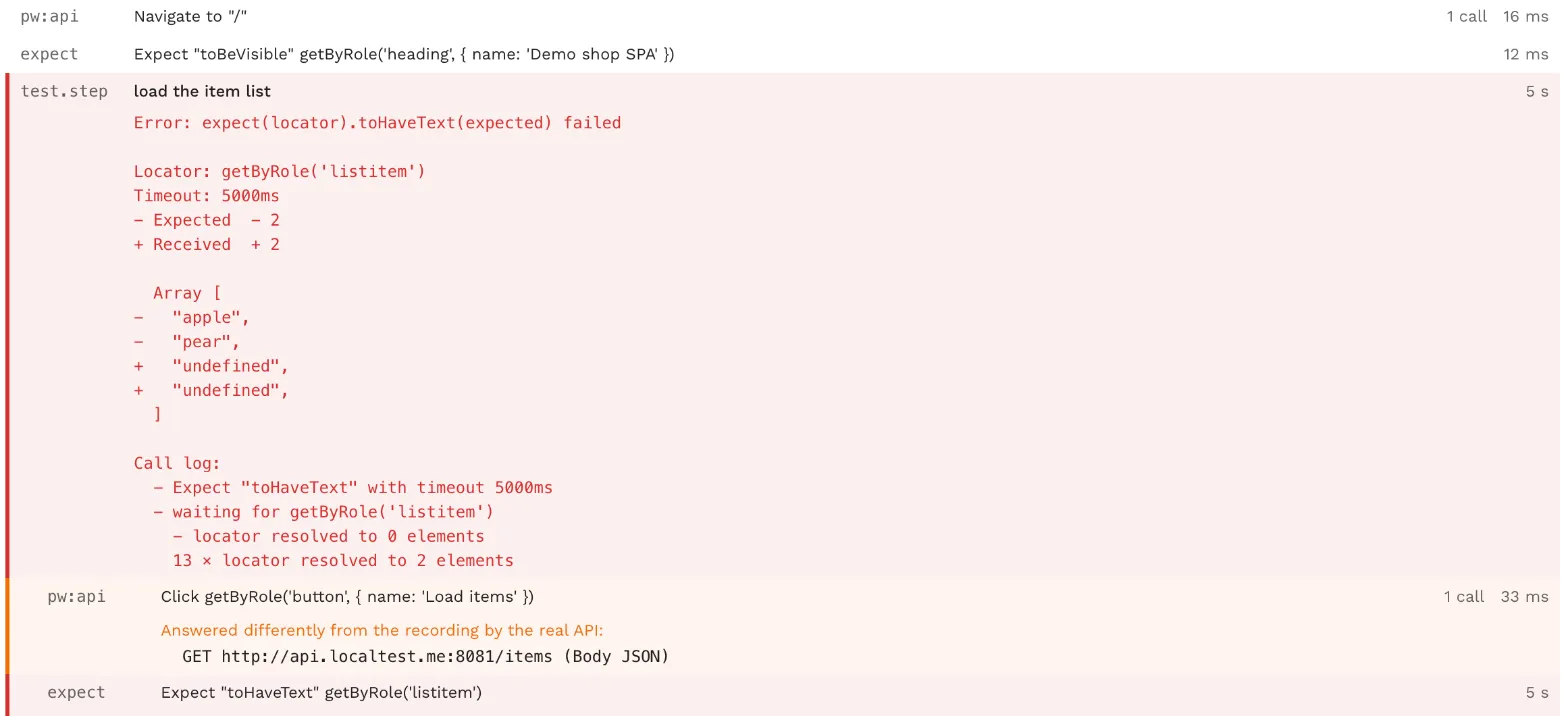
Under the click on Load items, the report now says the real API answered differently from the recording. (Body JSON) identifies what changed.
When you’re done:
make downWhat tripped me up
I hit two problems while building the lab that are worth checking if your results look wrong.
Check for an unread response body. My first version of the shop checked res.ok and threw without reading the body. The journey failed and the UI showed the 404, but Playwright reported the call as aborted with no status. That meant the report didn’t name the mock miss. Reading the response body before checking the status fixed it in the lab. If you see an aborted call with no status, inspect its trace before deciding the failure is in the page.
Use a separate test config id for each mode. A cloud-free run stages its config in the cluster’s forwarder. A later cloud run with the same id can read that staged copy, including whether it observes the real APIs. I ran a cloud-free replay with --no-mocks, then requested a cloud run with mocks on. Every call still passed through to the real API, and the report showed 0 of 8 matched. The lab uses separate ids, browser-journeys-mocks and browser-journeys-real, to avoid that mix-up.
Where to go next
Point it at your own frontend. --browser takes a folder of specs, --test-against or --target takes your frontend’s URL, and proxymock record --browser <url> makes the recording. The Browser Journeys docs cover writing journeys, starting signed in, goals on web vitals, and every setting.
If a step here doesn’t match what you see, open an issue on the lab. I’d like to know.
Frequently asked questions
Can I run Playwright tests without deploying the backend?
Yes. Record the frontend's API calls with proxymock record --browser, start proxymock mock on the recording, and run the specs with proxymock replay --browser --browser-proxy. The mock server answers the API calls, so the API tier can stay stopped.
How do I tell whether the frontend or the API broke a Playwright test?
Run the test as a browser journey replay. A failed journey can flag an API call the recording could not answer, or a real API response that differed from the recording. Check the failed step and trace too: no flagged call does not rule out an API problem, especially if a request was aborted.
Can I run the same Playwright tests in Kubernetes?
Yes. proxymock cluster replay start --browser runs the same spec files in a pod, with Chromium and a responder that answers the API calls from the recording. Add --no-mocks to send the calls to the real APIs instead.