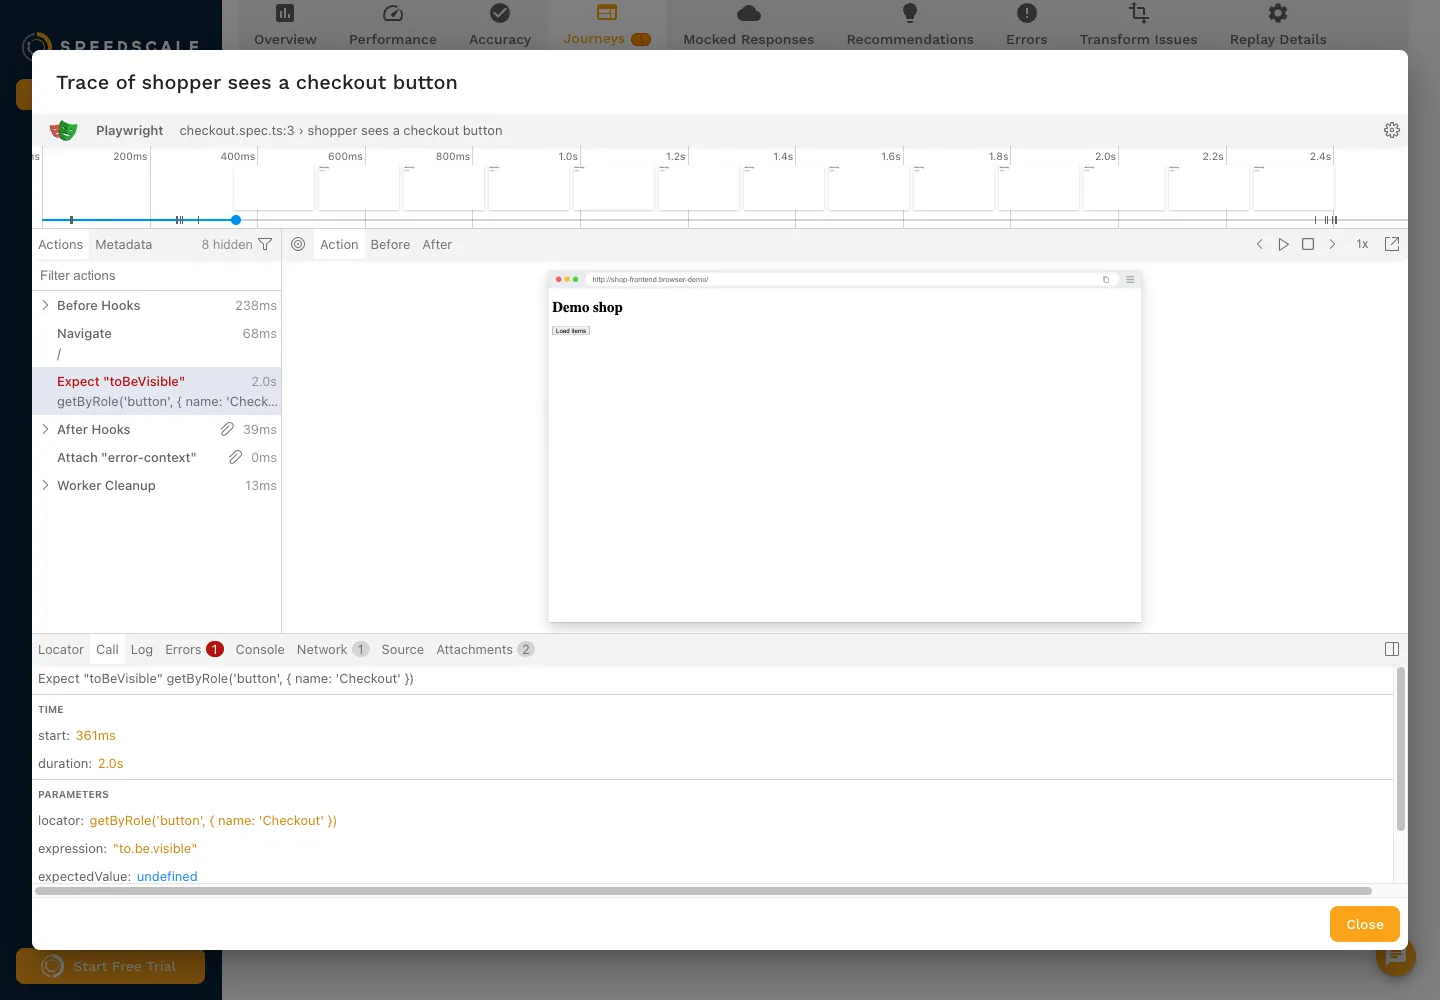
In April, I wrote about a familiar problem with UI synthetics: they tell you the building is on fire but not which room. The browser test turns red, but you’re left figuring out whether the UI, an API, or the data behind it caused the failure.
A customer running Playwright tests in their own Kubernetes cluster asked for a better answer. They already used recorded traffic to test their APIs. Could those same recordings help explain a failed browser journey, without replacing the Playwright tests they’d written?
That’s what we built: keep the browser test and connect it to the API calls behind each step.
Why a failed browser test leaves you guessing
A Playwright assertion can fail because the frontend changed, an API returned an unexpected response, or test data is out of sync. You know the journey broke. You don’t necessarily know why.
Run the test against staging and you inherit staging’s quirks: an account someone reset, a service that’s a release behind, or data nobody refreshed. Write your own mocks and you have another set of fixtures to maintain as the APIs change. Neither approach automatically reflects what your users actually saw.
Playwright can replay requests from a HAR file, which helps. But matching is strict on URL and HTTP method, and POST bodies have to match too. Add a timestamp to a request body and the recorded response might no longer match. Someone also has to keep the HAR current.
Same recording, both sides of the wire
Browser journeys let you keep your Playwright specs. Speedscale runs them in Chromium with a responder that handles the frontend’s API requests using recorded production traffic. It’s the same traffic Speedscale uses for API replay and mocking, with matching and normalization to account for IDs and repeated calls.
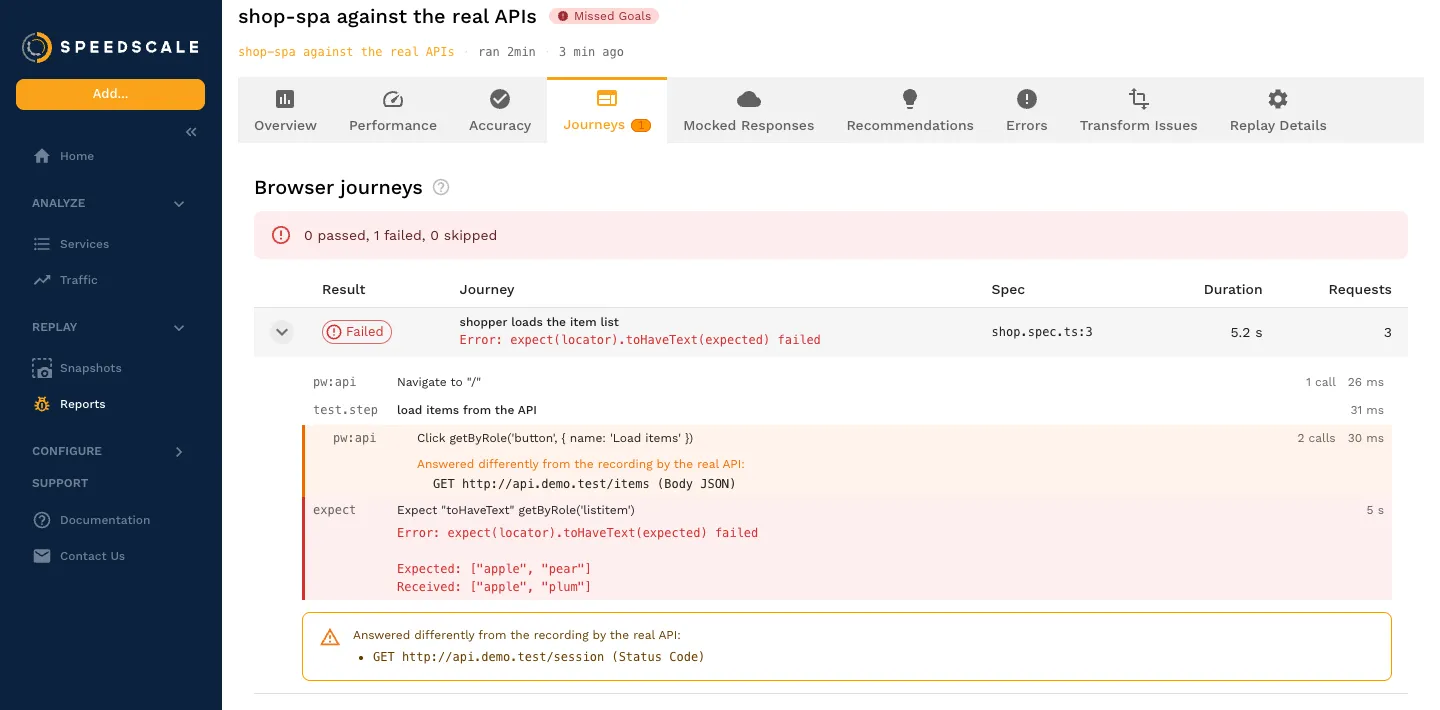
The useful part shows up when something fails. The report ties API calls to the Playwright step that made them, including requests that couldn’t be answered from the recording. Instead of chasing a failed assertion through logs, you can see what the browser asked for at that point.
For a local frontend running at http://localhost:3000, the workflow is:
proxymock record --browser http://localhost:3000
proxymock mock --in <recording>
proxymock replay --in <recording> --browser <recording>/journeys \
  --test-against http://localhost:3000 --browser-proxy http://localhost:4140
The first command opens Chromium with Playwright’s code generator. Click through your flow and close the window to save the spec and the API traffic behind it. The other commands serve those recorded responses and replay the journey. In Kubernetes, proxymock cluster replay start --browser ./journeys runs the specs in a generator pod with the responder beside the browser.
What changes when browser and API tests share recordings
Start with the test data. Your frontend can use responses captured from production without hand-writing fixtures or curating a HAR file for every flow. You can run the frontend even when the backend services aren’t deployed in your test environment.
That isn’t a replacement for synthetic monitoring. Tools like Datadog and Checkly check applications and services that are running. Checkly’s private locations can run checks inside your network, for example. Those checks answer whether the deployed system behaves as expected. A browser journey against recorded API responses answers a different question: does the frontend still behave as expected with a known set of backend responses?
Because Speedscale uses the same recordings for browser journeys and API replay, you can reuse the matching rules and auth-token transforms rather than maintain separate fixtures for each layer. And when a step fails, the report shows the API calls it made, including misses, alongside the browser result.
You can also run against the real backend instead of mocks. Speedscale compares the API responses with the recording and identifies differences such as a status code or JSON body change, tied to the Playwright step that triggered the request. That’s much more useful than a failed assertion on its own.
Meticulous also records browser interactions and mocks backend responses. Its focus is automated visual regression testing. The distinction here is using the same production recordings to test both API behavior and browser journeys, with reports that connect them. You can run locally, in your Kubernetes cluster, or in Speedscale cloud, depending on where the test data needs to stay.
A small bug in a very important feature
We learned the hard way that attributing an API call to a browser step isn’t as simple as it sounds.
Our first implementation stored each call’s step title in a comma-separated tag list. A normal Playwright title can look like Click getByRole('button', { name: 'Checkout' }). See the comma inside the selector?
That was enough to make local recordings with clicks unreadable. The bug reached a merge request before a test caught it.
There is nothing glamorous about fixing a comma in a tag. But if you can’t trust the mapping from browser actions to API calls, the whole feature loses its point.
Try it on a local app
With Node, @playwright/test and Chromium, and proxymock installed, record a journey against your frontend and replay it with API responses from the recording. The Browser Journeys docs explain how to start signed in, run journeys in Kubernetes, and read the results.
A failed browser test shouldn’t send you hunting through every service. It should show you the step that failed and the API calls worth investigating first.
Frequently asked questions
Can I run existing Playwright tests with Speedscale?
Yes. Speedscale runs ordinary Playwright spec files as a browser journey replay in Chromium, on your machine with proxymock or in Kubernetes, and reports each journey's steps, the calls each step made and web vitals.
How does Speedscale mock a frontend's API calls?
A responder beside the browser answers the frontend's API calls from recorded production traffic, the same recordings Speedscale uses to replay and mock APIs. Calls the recording cannot answer are flagged on the step that made them.
Can a browser test check the real APIs against a recording?
Yes. With mocks off, the frontend's API calls go to the real API and Speedscale compares the responses with the recording, naming the step and what differed, such as the status code or JSON body.