Let Your LLM Debug Using Production Recordings
Let Your LLM Debug Code Using Production Recordings
Modern LLM coding agents are great at reading code, but they still make assumptions. When something breaks in production, those assumptions can slow you down—especially when the real issue lives in live traffic, API responses, or database behavior.
In this post, I’ll walk through how to connect an MCP server to your LLM coding assistant so it can pull real production data on demand, validate its assumptions, and help you debug faster. Think of this as an MCP plugin for observability, except instead of just telemetry it can see what your system is actually doing.
We’ll use Speedscale and proxymock to wire everything together, then let Cursor automatically investigate a real production issue.
Watch the Demo
See this workflow in action:
Why MCP + Observability Changes Debugging
Most observability tools focus on metrics, logs, and traces. That’s useful but incomplete. When an LLM is trying to understand why something broke, it often needs answers to questions like:
- What did the actual API responses look like?
- Which downstream services failed?
- What data was returned by third-party APIs?
- What changed in the payloads in the last few minutes?
By connecting an MCP server to a production-aware tool, you let your coding agent ask those questions directly—without you pre-deciding what data it should fetch.
How Speedscale Fits In
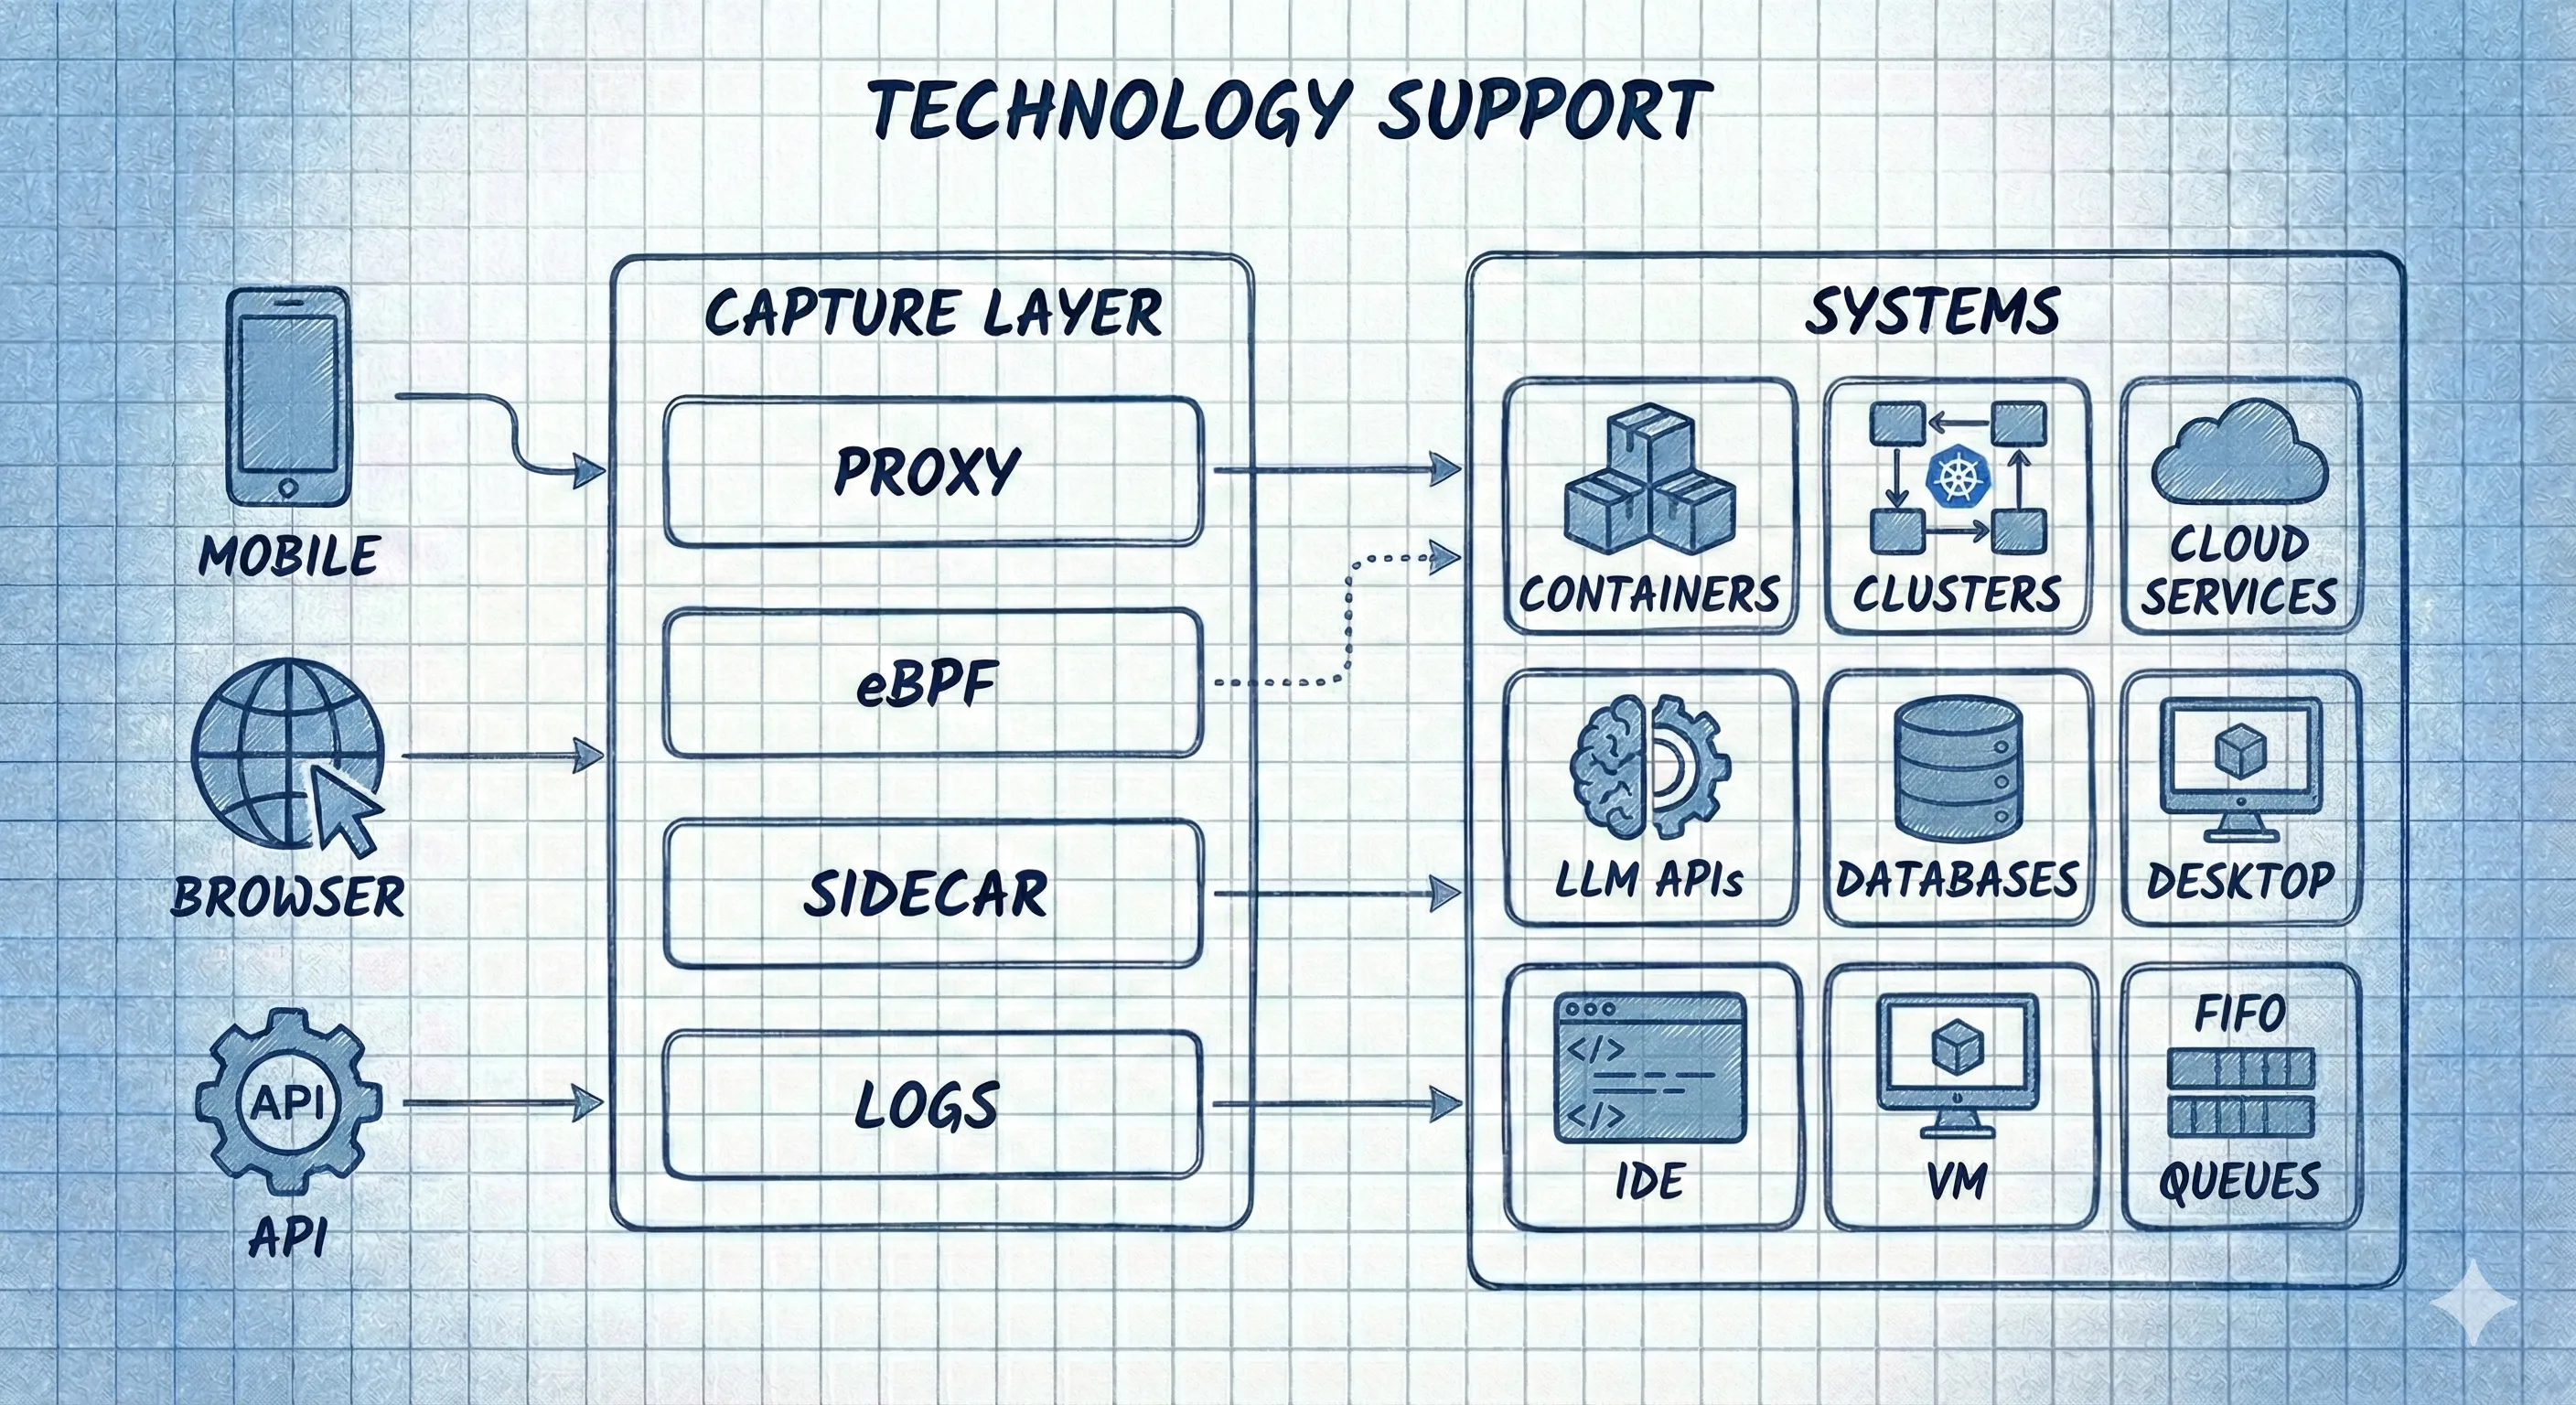
Speedscale works by dropping a recorder into your runtime environment—Kubernetes, EC2, containers, or anywhere your app runs. It records real production traffic, including:
- API calls
- Service-to-service interactions
- Database behavior
- Third-party dependencies
That recorded data can then be accessed programmatically—perfect for an MCP server that an LLM can query when it needs real answers.
Step 1: Install proxymock
To bridge your LLM and production data, we’ll use proxymock, a lightweight CLI that also acts as an MCP server.
Once installed, proxymock behaves a lot like other AI CLIs (for example, Claude Code): it runs locally and integrates with your IDE and coding assistants.
Install proxymock and it should ask you to install MCP connectors for your AI coding assistants automatically.
brew install speedscale/tap/proxymock
proxymock init
If the MCP setup doesn’t run automatically during install, you can trigger it manually by running proxymock install mcp
During installation (or triggered manually) proxymock will:
- Discovers installed IDEs and AI coding assistants
- Automatically configures them to use proxymock
- Sets up the MCP server without manual wiring
Step 2: Verify the MCP Configuration
Behind the scenes, proxymock updates your IDE’s MCP configuration (for example, mcp.json in Cursor).
You’ll see a new MCP server entry for proxymock, along with the command Cursor uses to launch it. This is standard MCP wiring—we just automate it so you don’t have to think about it.
Step 3: Start Monitoring Your App
Install the Speedscale collector for one of the supported environments:
Step 4: Ask a Simple Question
In Cursor’s normal chat window, ask a single prompt:
Why is outerspace-go returning 500s over the past 15 minutes?
Because of the MCP connection, Cursor already knows it has access to runtime information—and it can decide when to use it.
Step 5: Watch the LLM Validate Its Assumptions
Here’s what happens next:
- Cursor searches the codebase
- It queries real production traffic from the last 15 minutes
- It identifies failing requests and inspects responses
- It finds the NASA API returning rate-limit errors
- It explains the cause and suggests fixes
All of this happens automatically.
Why This Matters
This workflow shows a powerful shift in debugging:
- LLMs don’t just read code—they interrogate reality
- Production data becomes an on-demand reasoning tool
- You spend less time gathering evidence and more time fixing problems
This is what closing the Observability Gap looks like in practice. Traditional observability tells you what happened via dashboards. MCP-connected observability lets AI agents see the actual traffic and verify their own code changes against production behavior — turning monitoring data from a diagnostic tool into a validation tool.
Get Started
- Try proxymock MCP for free
- Upgrade to Speedscale for full production recording
- Learn more at https://speedscale.com