Performance tests, end-to-end tests, integration tests. There are many different types of tests you can run on your infrastructure. One of the most overlooked kinds is load testing. Failure to include load tests in your supply chain can be detrimental, as you will be missing out on a number of benefits. Some of the big advantages of load testing Kubernetes are:
- Improve your performance overview
- Verify the stability of your services
- Gain a direct view into how your services are communicating
In this blog post, we use podtato-head to demonstrate how to load test Kubernetes microservices and explain how Speedscale can help you understand the relationships between them. No, that’s not a typo, podtato-head is an example microservices app from the CNCF Technical Advisory Group for Application Delivery, and there are many ways to deploy it, from direct deployment with kubectl to templated deployments using kustomize, helm, etc.
There are more than 10 delivery examples, so you will surely learn something by going through the project. We liked it so much that we forked the repo so that we could contribute our improvements. Make sure to clone the repo so you can follow along with the tutorial.
Setting the Ground Rules - What is Kubernetes?
Before we dive into this process, let’s set some definitions. Kubernetes is an open-source platform designed for container orchestration, enabling developers to automate the deployment, scaling, and management of containerized applications. Container orchestration is the process of managing containers, such as a Docker image, allowing you to create, manage, and delete containerized applications at scale. By abstracting away the complexities of manual infrastructure management, Kubernetes provides a powerful system for building modern, scalable applications. A typical Kubernetes cluster includes components like nodes, which host running containers, and a namespace, which organizes resources and workloads. Items in the same namespace are likely to be related, while content on the same node may or may not be directly related but are nonetheless contextually relevant to each other. With tools like Google Kubernetes Engine (GKE), developers can access a managed Kubernetes environment, simplifying infrastructure management while maintaining the flexibility to customize their deployments. Kubernetes also supports robust scaling features, making it ideal for managing high-demand applications and diverse workloads across distributed systems.
Why Load Test Kubernetes?
Performance testing in a Kubernetes environment is essential for ensuring applications can handle high network traffic, scale effectively, and maintain high performance under stress. Conducting distributed load tests allows teams to simulate real-world scenarios, such as thousands of virtual users interacting with the system simultaneously.  By performing load testing in Kubernetes, developers can identify performance issues like latency, resource bottlenecks, and inconsistencies in response times. Testing on Kubernetes is particularly valuable because its dynamic features, such as spinning up new pods, mimic real operational conditions. Using a distributed load testing tool configured with Kubernetes operators or defined in a yaml file, teams can ensure load tests are integrated seamlessly into the development process. For example, tools like Crocodile Stress Test File, scripts using export default function, or other tools focused on this area of testing allow developers to write tests that capture specific metrics, such as CPU utilization or memory demand. Load testing not only evaluates the application performance but also provides valuable insights into system behavior, helping teams optimize the allocation of resources and predict future infrastructure needs.
Setting up Minikube
Before you can get started with anything, you first need to install Minikube. This tutorial was written on a Mac, and as such, the examples you find here will be for MacOS. However, you can find alternative installation instructions here. To install Minikube on a Mac, run the following:
curl -LO https://storage.googleapis.com/minikube/releases/latest/minikube-darwin-amd64 && \
  sudo install minikube-darwin-amd64 /usr/local/bin/minikube
Next, we’ll start Minikube with the networking option enabled for the Container Networking Interface (CNI). Without this, traffic within the Kubernetes network won’t flow between pods by default. On a Mac, you need to install the hyperkit driver to run Kubernetes inside a virtual machine.
You can tune the memory, CPUs, and disk size allocated to the VM to suit your needs and hardware, but an example command looks as follows:
brew install hyperkit # Only needs to be run the first time
minikube start --cni=true --vm=true --memory=8g --cpus=4 --disk-size=128g
Verifying Podtato-Head Access
Once Minikube has been installed and set up, it’s time to configure podtato-head so you can start performing load tests.
There are many ways to interact with Minikube and get access to the services running inside it. The easiest approach for this tutorial is to use kubectl, for two main reasons:
- To interact with Kubernetes, you need an up-to-date version of
kubectl, meaning you won’t have to install any additional tools. - Also, there are no dependencies on the cluster.
To get podtato-head running, execute the following command:
kubectl apply -f https://raw.githubusercontent.com/speedscale/podtato-head/main/delivery/kubectl/manifest.yamlThis will tell Minikube to start deploying podtato-head. Within a few minutes, it should be ready. Double check that your pods are running:
$ kubectl get pods
The following automatically deploys a load balancer, which runs on plain HTTP and listens on port 31000:
LB=$(minikube ip)
echo $LB
You can see it by going to the URL printed out by the last command in your browser. On a Mac, you can see it by running:
open http://${LB}:31000You should see a friendly face with all four of its limbs!
Instrumenting Podtato-Head with Speedscale
To demonstrate how an efficient load test can be carried out in Kubernetes, we’ll show you how to set up and use Speedscale. If you don’t have Speedscale already, sign up for a free trial here and then download speedctl.
It’s also possible to install Speedscale using Helm, which you can read more about in the Quick Start Guide.
$ sh -c "$(curl -Lfs https://downloads.speedscale.com/speedctl/install)"Once you have speedctl on your machine, you can use it to install the Speedscale Operator in your cluster. It is recommended to use the default settings (at least for the first run through). Now, instrument all the podtato-head deployments:
speedctl install

This will guide you through an installation wizard, and at the end you should see the following:

✔ Deployments patched.
  ℹ Patched default/podtato-head-entry
  ℹ Patched default/podtato-head-hat
  ℹ Patched default/podtato-head-left-arm
  ℹ Patched default/podtato-head-left-legp
  ℹ Patched default/podtato-head-right-arm
  ℹ Patched default/podtato-head-right-leg
Now you need to generate some traffic, which can be done by simply refreshing your browser a few times.
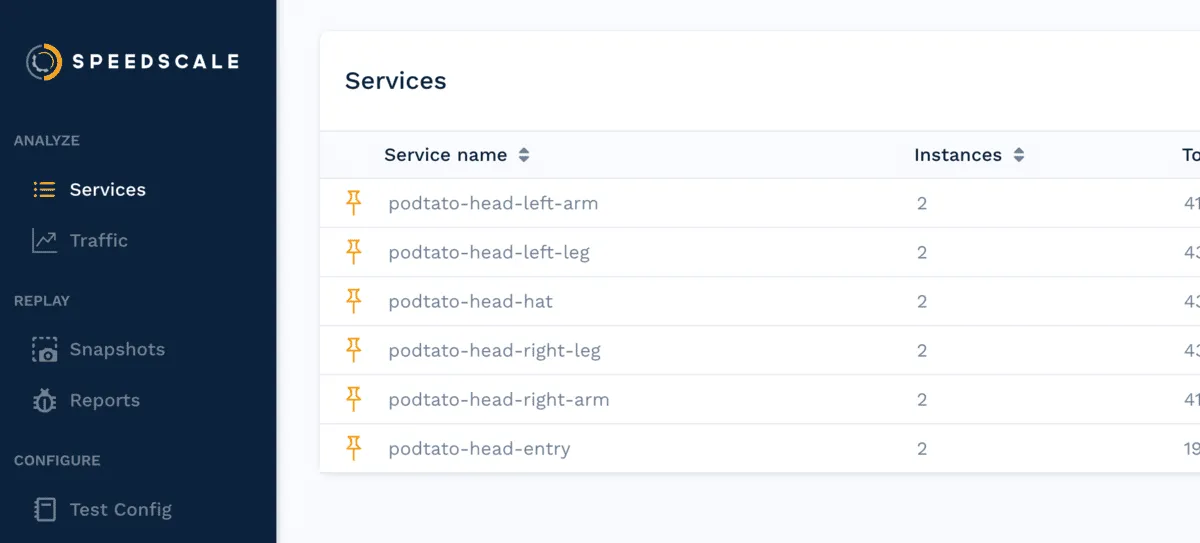
After a few minutes, you should see the various services on your home page like so:

Drill Down for API Visibility
Before you can start to execute the load test, it’s important that you first understand how traffic is organized within the Speedscale domain.
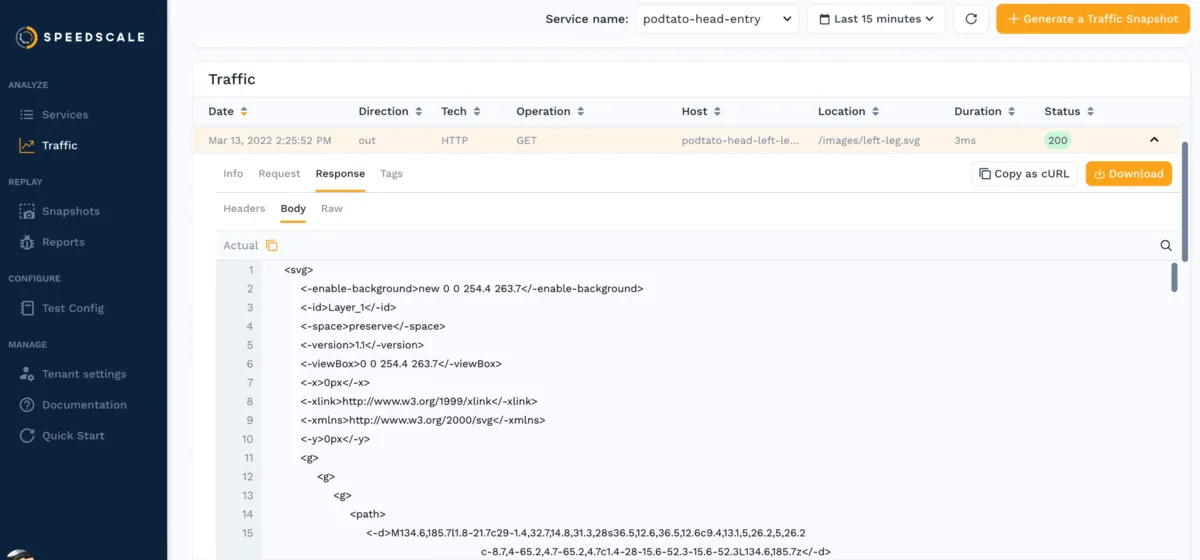
If you click on the podtato-head-entry, you will see a map that shows the relationships among the various services. The entry service is responsible for fetching images from all of the other services, which you can clearly see in the service map:

From the table, you can see exactly what the call is from the entry service to each outbound API. It fetches the SVG of the image that is shown on the home page. In your apps, you can use this drill down to inspect what is being sent and what data is received between your internal and external services. You might spot that a SaaS endpoint changed the body of responses and that your current libraries aren’t up to date. Speedscale’s traffic viewer can help diagnose this issue.
You may want to read our case study about all the ways Speedscale can help you detect problems in your infrastructure.

By using this observed traffic, you can replay the traffic as a load or performance test scenario to understand the limits of our Kubernetes cluster. Click on the Generate a Snapshot button, and this portion of traffic will be analyzed and stored for future use. (Accept the default settings in the wizard.)
Load Test Kubernetes with Traffic Replay
Running a replay of the snapshot is as simple as applying a patch file. Note that this patch refers to the original traffic snapshot (yours will have a specific unique id), and it also references a test config to run through the traffic at 10x what was originally recorded. Be sure to update the testconfig-id to performance_10replicas.
Feel free to try out a few variations of the test config for different load patterns. These patterns are stored in customizable test configurations that can help you load test your application or transform traffic to generate chaos tests for test and staging environments.
Save the following to a file called patch.yaml:
apiVersion: apps/v1
kind: Deployment
metadata:
  name: podtato-head-entry
  annotations:
    replay.speedscale.com/snapshot-id: UUID
    replay.speedscale.com/testconfig-id: performance_10replicas
    replay.speedscale.com/cleanup: "inventory"
    sidecar.speedscale.com/inject: "true"
Run the replay by executing:
kubectl patch deployment podtato-head-entry --patch-file patch.yamlWe can check for the Speedscale pods during our run by checking the namespace. These will disappear once testing is done.
kubectl get podsAfter replaying the traffic, the test pods will disappear, and you will see your replay on your traffic screen. It may take a moment to process, depending on how much traffic you send. First, though, at the top of the page, you can see how requests for the different parts of the image were retrieved from your various backend services. This can be useful when trying to track down service dependencies in your own web application too. For example, there could be an old application that you rely on that everyone thought was decommissioned, but it’s still sending and receiving traffic.

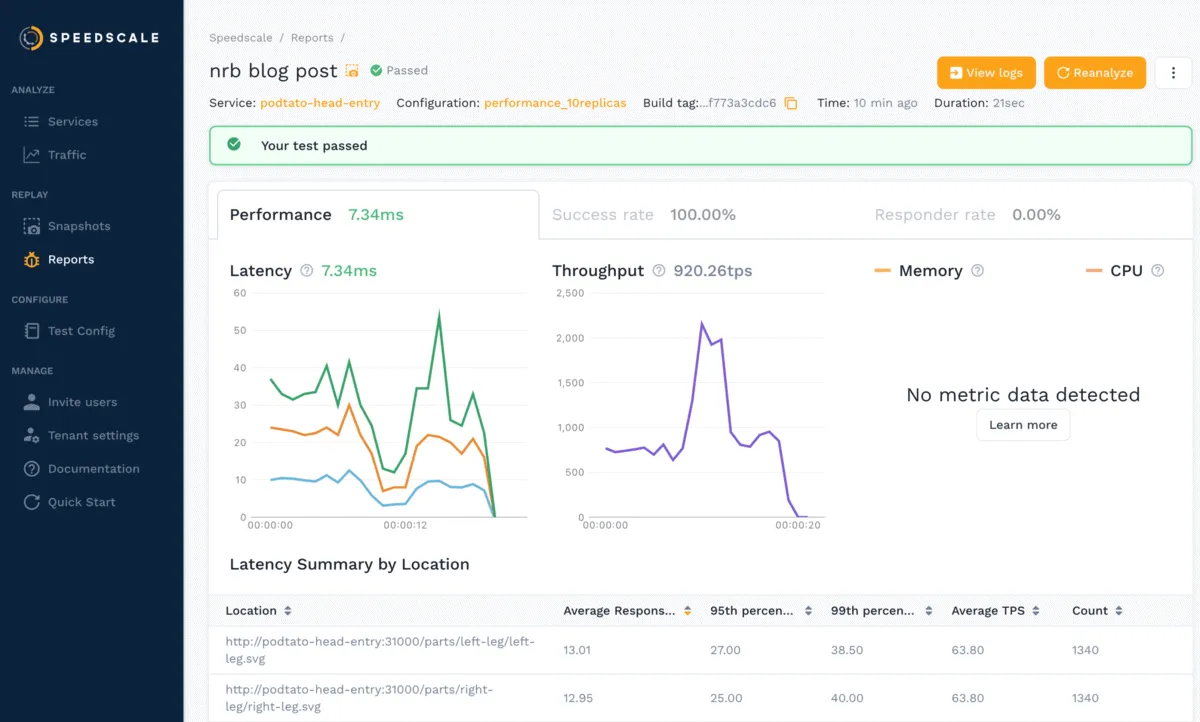
Next, clicking on the replay will take you to a replay report.

Here, you can see metrics such as the average latency of requests, throughput, and a breakdown by endpoints tested. Memory and CPU usage are collected if the Kubernetes metrics server is installed and configured, which we did not manage to do in this demo. The latency, throughput, and hardware metrics can be helpful in identifying slow services or endpoints or for identifying the best cost-to-performance hardware for your application.
Load Test Kubernetes with Speedscale
Hopefully, this demonstration has been useful for showing you how quickly you can load test Kubernetes microservices and how Speedscale can help you understand the relationships between them! Sign up for a free trial and test it out in your own environment today!

Or, if you’re unsure about whether Speedscale is the right choice for your Kubernetes load tests, you can check out our comparison between Speedscale and four other popular load testing tools here.