Essential KPIs for Software Development: Measure Success Effectively
In almost all industries, a standard set of KPIs helps to guide teams on whether they are doing the right things in the right ways, with the right outcomes. In software development, this has evolved significantly with industry-standard frameworks like DORA metrics (DevOps Research and Assessment), which have been validated across thousands of organizations worldwide. Some development frameworks, such as Agile, have some KPIs baked directly into them. For example, when calculating your team’s story point velocity, you likely establish a benchmark after a few sprints, which becomes a team KPI to meet or exceed. However, modern engineering leaders are increasingly combining multiple frameworks—DORA, SPACE, and DevEx—to get a complete picture of team performance, developer experience, and business impact.

In this blog, we’ll explore what software development KPIs are in 2025, examine industry-standard frameworks that elite engineering teams use, and provide best practices for teams looking to measure and improve their software delivery performance. With the rise of AI-assisted development and platform engineering, understanding how to measure productivity and effectiveness has never been more critical. Let’s start by looking at what makes a good software development KPI.
What are Software Development KPIs?
KPIs - or Key Performance Indicators - are quantifiable metrics that help track a software development team’s progress toward a predefined goal. In essence, the KPI gives a metric by which progress can be tracked, giving a signal both when you are pacing toward success and failure. KPIs act as a bridge, connecting development efforts at the team level with broader business objectives. In many teams, the project success may not feel directly connected to the business value - with KPIs, software developers have a clear roadmap towards how their code quality, software tasks, flow efficiency, etc., level up towards a meaningful and measurable impact on the overall business value and goals.
Importance of KPIs in Software Development
Establishing clear software development KPI metrics and ensuring a team has the tools and abilities to meet them can significantly increase the chances of delivering high-quality software on schedule and within budget. Research from DORA shows that elite performers are twice as likely to meet organizational goals, deliver faster customer value, and maintain higher developer satisfaction. KPIs are not just an end goal in the distance—they form a North Star that can be targeted and measured against.
Effectively tracking KPIs allows you to manage specific issues and prioritize the metrics that matter most. For instance, KPIs help build better observability in the development flow, which can identify bottlenecks, reveal trends in software quality and iterative processes, and measure progress against the overall schedule. Modern KPI frameworks also emphasize developer experience—measuring whether your team has the focus time, psychological safety, and tools needed to be effective. This holistic approach helps development efforts align more closely to business goals while maintaining a healthy engineering culture and preventing burnout.

Types of KPIs for Software Development
DORA Metrics: The Industry Standard
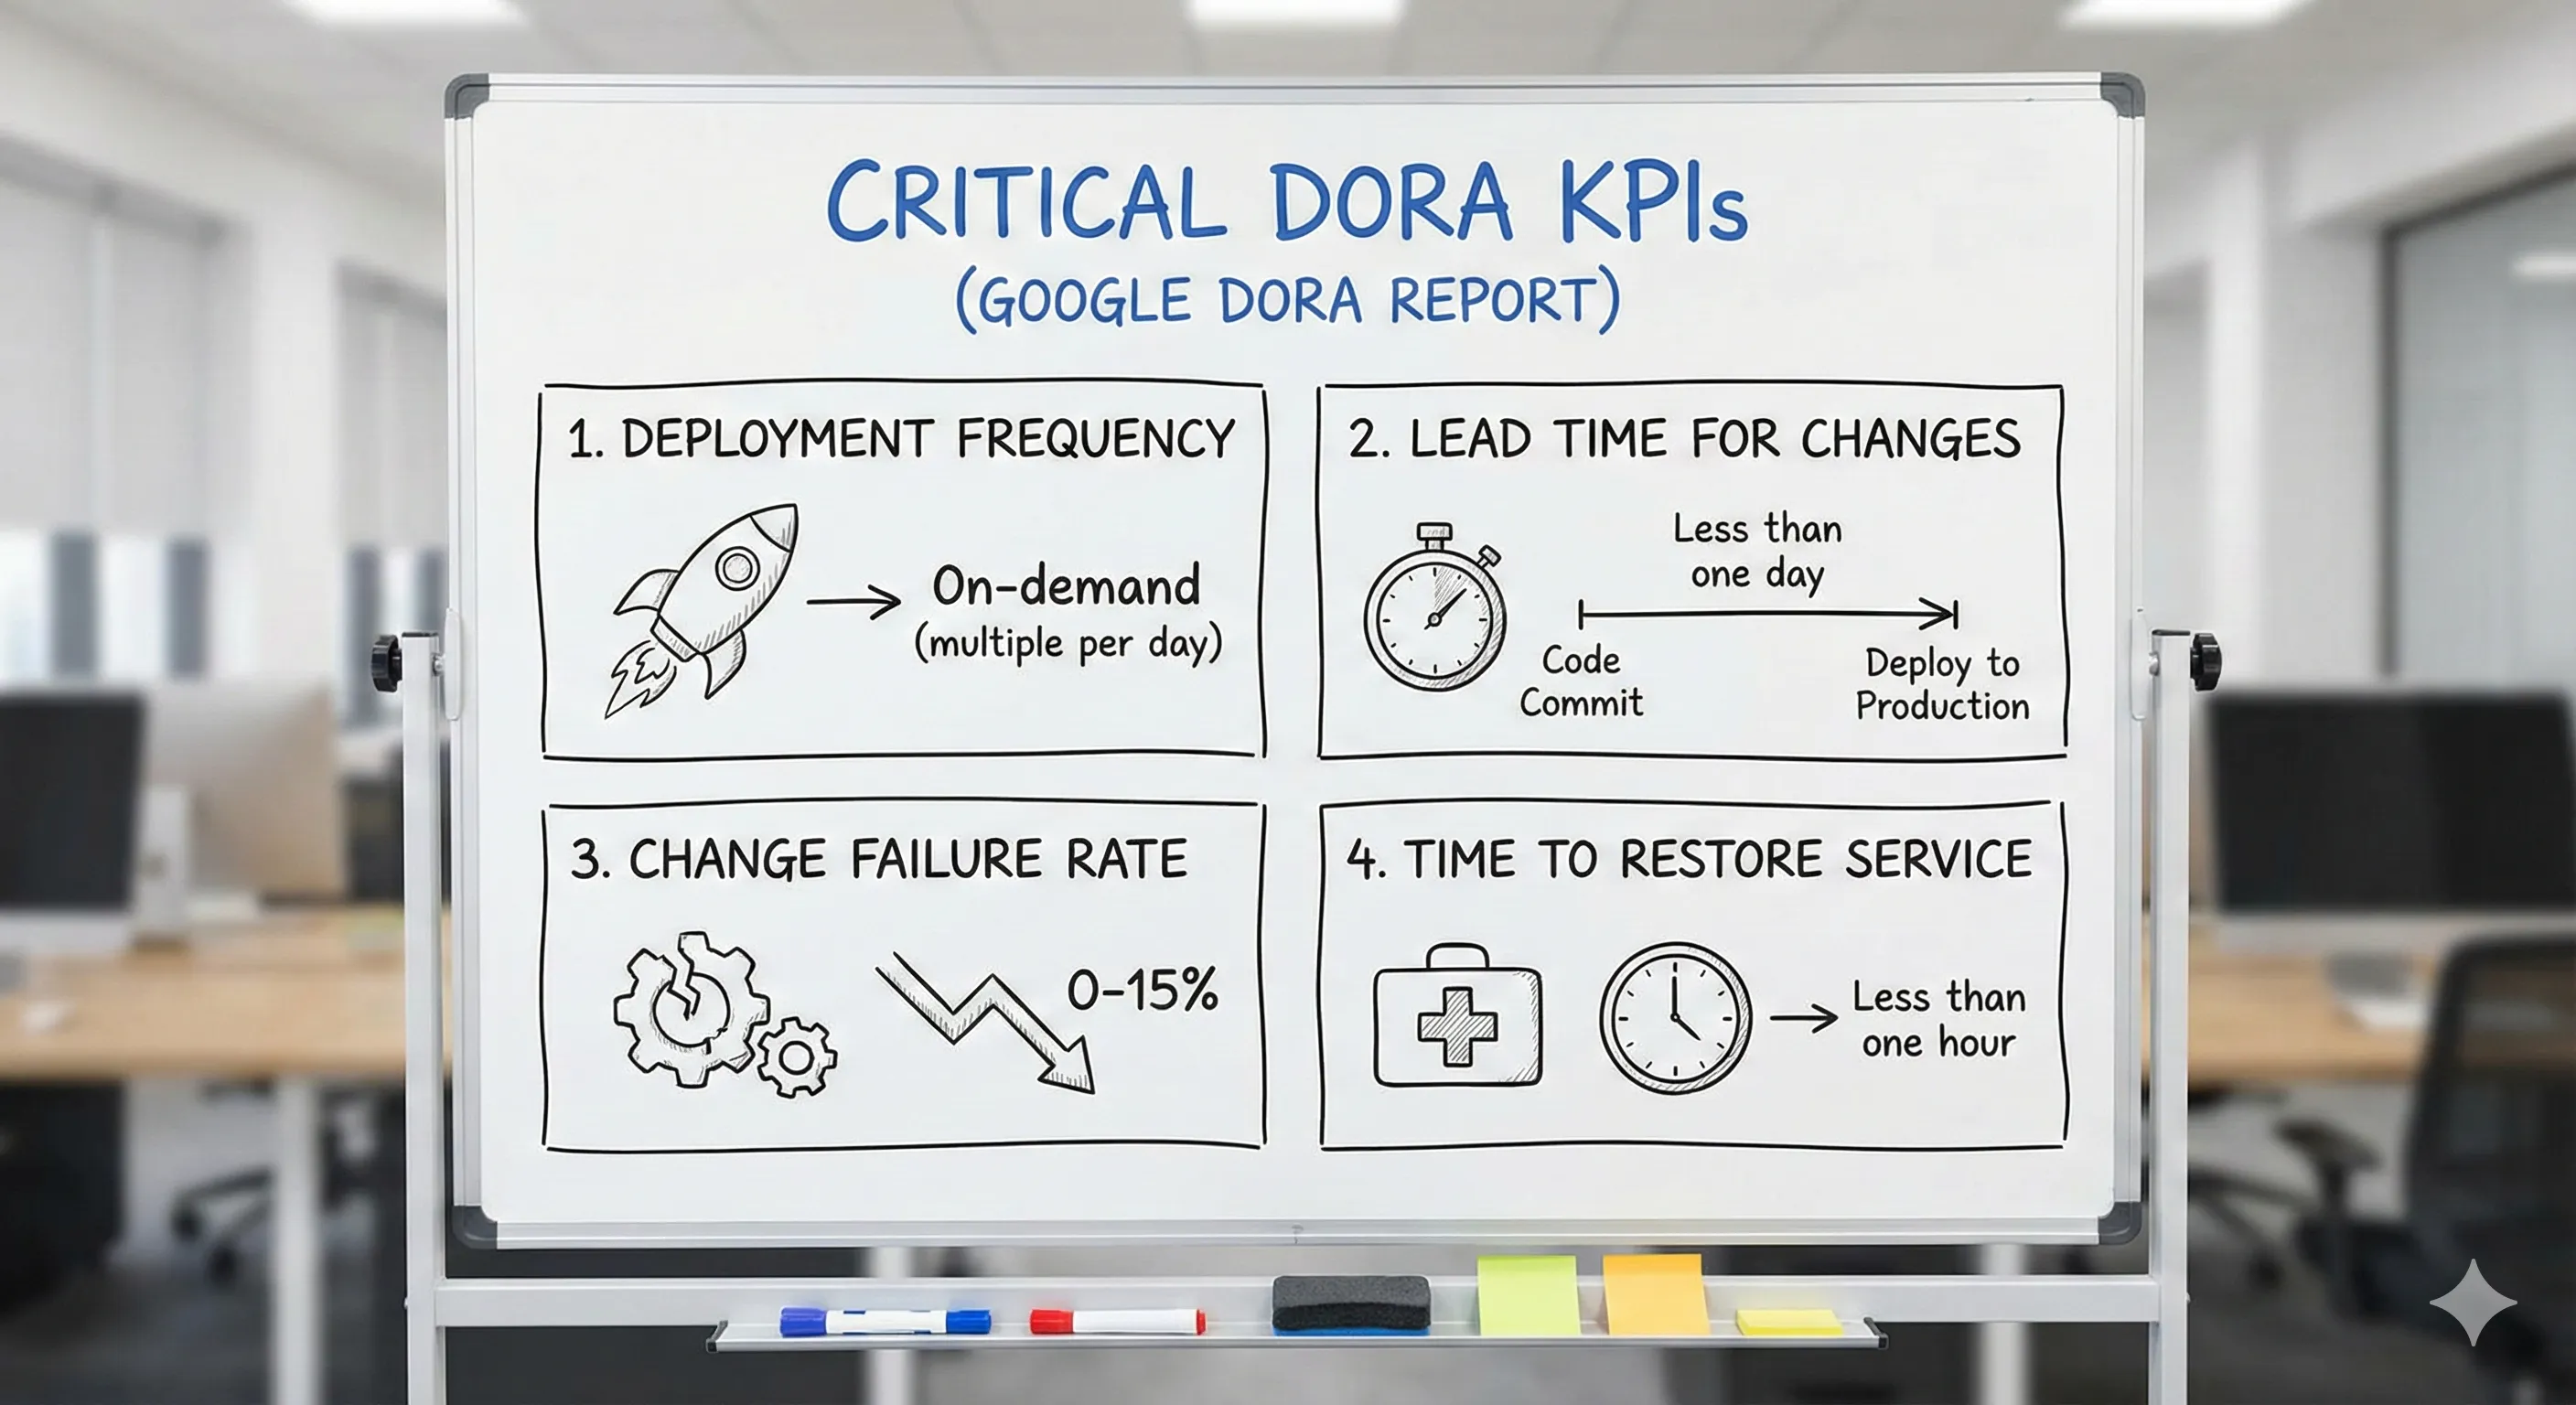
The DORA (DevOps Research and Assessment) metrics have become the gold standard for measuring software delivery performance. Developed by Google Cloud’s DORA team and validated across thousands of organizations, these four key metrics provide a comprehensive view of both throughput (speed) and stability (quality) of your software delivery process.
The Four DORA Keys
Throughput Metrics:
-
Deployment Frequency - How often your team successfully releases code to production. Elite performers deploy multiple times per day, while high performers deploy between once per day and once per week. This metric reflects your team’s ability to deliver value quickly and continuously.
-
Lead Time for Changes - The time it takes from code commit to code running successfully in production. Elite teams achieve lead times of less than one hour, while high performers complete changes in less than one day. This metric reveals your pipeline efficiency and ability to respond to market demands.
Stability Metrics:
-
Change Failure Rate - The percentage of deployments that cause failures requiring remediation (hotfix, rollback, patch). Elite performers maintain a change failure rate between 0-15%, demonstrating their ability to deliver speed without sacrificing quality.
-
Mean Time to Recovery (MTTR) - How quickly your team can restore service after an incident or failure. Elite performers recover in less than one hour, while high performers recover in less than one day. This metric measures your resilience and incident response capabilities.
DORA Performance Tiers
Organizations are categorized into four performance tiers based on their DORA metrics:
- Elite: Multiple deployments per day, <1 hour lead time, 0-15% change failure rate, <1 hour MTTR
- High: Weekly to daily deployments, <1 day lead time, 16-30% change failure rate, <1 day MTTR
- Medium: Monthly to weekly deployments, 1 week to 1 month lead time, 16-30% change failure rate, 1 day to 1 week MTTR
- Low: Less than monthly deployments, 1-6 months lead time, >30% change failure rate, >1 week MTTR
The key insight from DORA research is that high-performing teams excel across all four metrics simultaneously—they don’t sacrifice stability for speed or vice versa. According to DORA’s research, elite performers are twice as likely to meet their organizational performance goals. The challenge for many teams is balancing speed with quality—shipping frequently while maintaining low change failure rates.
Customer Metrics
Customer metrics are metrics that measure customer satisfaction, retention, and efficiency. These metrics provide critical insights into your software’s effectiveness at satisfying, acquiring, and retaining users. Metrics such as Customer Acquisition Cost (CAC) or Customer Lifetime Value (CLV) allow you to understand the efficiency of your software development in converting users to long-term monetary value. Other values like the Net Promoter Score (NPS) allow you to get a sense of the quality of your product through customer satisfaction, e.g., how much the user likes the product in practice on a scale of zero to ten.
Performance Metrics and Development Efficiency
Performance metrics measure how efficiently your development process operates. While DORA metrics focus on deployment and delivery, other performance indicators provide additional insights into your workflow. These include cumulative flow diagrams, sprint burndown charts, and cycle time analysis that help identify bottlenecks in your development pipeline.
Key performance metrics include:
- Cycle Time - The time from when work starts on a feature until it’s deployed (closely related to DORA’s Lead Time for Changes)
- Sprint Velocity - The amount of work a team completes within a sprint, measured in story points or similar units
- Pull Request (PR) Metrics - Time to first review, time to merge, and PR size, which indicate collaboration efficiency
- Work in Progress (WIP) - The number of items actively being worked on, with lower WIP often correlating to faster delivery
It’s important to note that these metrics should complement, not replace, DORA metrics. Research analyzing almost 3,000 dev teams shows that successful organizations balance speed metrics with quality and developer experience indicators.
Quality and Reliability
Quality and reliability metrics ensure your code is robust, maintainable, and production-ready. While DORA’s Change Failure Rate captures deployment quality, additional metrics provide deeper insights into code health:
- Code Coverage - The percentage of code tested through automated testing. While 100% coverage is rarely practical, most high-performing teams aim for 70-80% coverage on critical paths
- Defect Density - Number of defects per lines of code or per feature, helping identify quality trends over time
- Technical Debt Ratio - The cost to fix issues versus the cost to develop new features, often measured through static analysis tools
- Cyclomatic Complexity - Measures code complexity and maintainability, with lower complexity generally indicating more maintainable code
These metrics help teams identify areas needing refactoring and ensure sustainable development practices. Remember that quality metrics should never be used in isolation—gaming metrics like code coverage without focusing on meaningful tests can lead to false confidence in code quality.
Deployment and Maintenance
Deployment and maintenance KPIs track how effectively you release and maintain software in production. The DORA metrics (Deployment Frequency, Change Failure Rate, and MTTR) form the foundation of this category, but additional metrics can provide valuable context:
- Rollback Rate - Percentage of deployments that require rollback, indicating deployment process maturity
- Deployment Duration - Time required to complete a deployment, affecting your ability to respond to issues
- Environment Consistency - Differences between development, staging, and production environments that could cause deployment issues
- Incident Response Time - Time from incident detection to beginning remediation (distinct from MTTR, which measures time to full recovery)
These metrics complement DORA by providing operational insights into your deployment pipeline and production reliability.
Developer Experience and the SPACE Framework
In 2025, leading engineering organizations recognize that developer productivity and satisfaction are critical KPIs. The SPACE framework, developed by researchers at GitHub, Microsoft, and the University of Victoria, provides a holistic approach to measuring developer productivity across five dimensions:
- Satisfaction and Well-being - Developer satisfaction, happiness, and perceived productivity. Measured through surveys and retention rates
- Performance - The outcomes of development work, including code quality, reliability, and customer satisfaction (aligns with DORA metrics)
- Activity - The volume and frequency of development actions like commits, PRs, and deployments (should never be used in isolation)
- Communication and Collaboration - How well teams work together, measured through PR review times, documentation quality, and knowledge sharing
- Efficiency and Flow - The ability to complete work with minimal interruptions, including focus time, context switching, and cycle time. Tools like ephemeral environments can significantly improve flow by giving developers isolated testing environments
The SPACE framework emphasizes that no single metric tells the complete story. For example, high activity (many commits) might indicate productivity or might signal thrashing and rework. Combining multiple dimensions provides accurate insight.
AI Impact on Modern KPIs
With the rise of AI-assisted development tools in 2025, traditional metrics require new interpretation. Research shows that AI copilots affect:
- Code Volume - Developers write more code faster, but this doesn’t automatically translate to better outcomes
- Review Patterns - AI-generated code may require more careful review despite faster initial development
- Testing Needs - Comprehensive testing becomes even more critical with AI-assisted development
- Learning Curves - Teams must balance AI productivity gains with skill development and code understanding
The key is measuring outcomes (working features, reliability, customer value) rather than outputs (lines of code, commits). AI makes output metrics even less meaningful than before.
Choosing the Right KPIs
Selecting the right KPIs is crucial for your team and organization. In 2025, the most successful approach is to start with DORA metrics as your foundation, then layer in additional metrics based on your specific context and goals.

Start with DORA Metrics
Every software team should track the four DORA keys—Deployment Frequency, Lead Time for Changes, Change Failure Rate, and MTTR. These metrics are validated across thousands of organizations and provide a balanced view of both speed and stability. Start by establishing your baseline across all four metrics to understand your current performance tier.
Layer in Context-Specific Metrics
Once you have DORA metrics in place, add metrics that address your specific challenges:
- If quality is a concern: Add defect density, test coverage, and technical debt tracking
- If developer satisfaction is low: Implement SPACE framework measurements, particularly satisfaction surveys and flow state metrics
- If customer impact is unclear: Track customer-facing metrics like NPS, CAC, and feature adoption rates
- If collaboration is challenging: Monitor PR review times, documentation quality, and knowledge sharing indicators
Avoid Common Pitfalls
Goodhart’s Law warns that “when a measure becomes a target, it ceases to be a good measure.” Avoid these mistakes:
- Don’t measure in isolation: High deployment frequency means nothing if change failure rate is also high
- Don’t optimize for metrics alone: Gaming metrics (e.g., making trivial commits to boost activity) destroys their value
- Don’t ignore developer experience: Burned-out teams with great metrics won’t sustain performance
- Don’t use output metrics: Lines of code, number of commits, and story points are poor proxies for value delivered
Align with Business Objectives
While DORA provides technical excellence metrics, ensure your KPIs connect to business outcomes. For example, if time-to-market is critical, emphasize Lead Time for Changes. If reliability is paramount, focus on Change Failure Rate and MTTR. The key is ensuring that improvements in your engineering KPIs translate to improvements in business results—faster feature delivery, better customer satisfaction, or reduced operational costs.
Best Practices for Implementing KPIs
Setting software development KPIs effectively is critical for aligning software development projects with a company’s strategic objectives. Research from DORA shows that elite performers follow specific practices when implementing KPIs. Below are best practices for setting up your software development KPIs to foster continuous improvement, build stronger teams, and deliver high-quality software.
Establish Baselines Before Setting Goals
Before setting ambitious targets, understand where you are today. Measure your current DORA metrics, developer satisfaction scores, and quality indicators for at least 2-4 weeks to establish reliable baselines. Use these baselines to set realistic improvement targets—focus on moving up one performance tier over a quarter rather than trying to reach “Elite” immediately.
Align KPIs with Strategic Objectives
KPIs should reflect the broader goals of the organization and support software development efforts aimed at achieving business outcomes. For instance, if the strategic objective is to enhance product reliability, prioritize DORA’s Change Failure Rate and MTTR alongside defect density metrics. If rapid innovation is the goal, emphasize Deployment Frequency and Lead Time for Changes. The key is ensuring your engineering metrics drive toward business value, not just technical perfection.
Focus on Relevant Software Engineering KPIs
Selecting key software engineering KPIs that resonate with project goals is essential to generating buy-in with the teams who will be measured. In 2025, successful organizations prioritize these metrics:
- DORA Four Keys - The non-negotiable foundation: Deployment Frequency, Lead Time for Changes, Change Failure Rate, and MTTR
- Developer Satisfaction - Regular surveys measuring happiness, perceived productivity, and psychological safety (from SPACE framework)
- Code Review Efficiency - Time to first review and time to merge, indicating collaboration health
- Test Coverage on Critical Paths - Focus on meaningful coverage rather than arbitrary percentage targets
- Technical Debt Trends - Monitoring whether debt is growing or shrinking over time
Avoid vanity metrics like total lines of code, number of commits, or story points completed—these can be gamed and don’t correlate with business value.
Involve Software Engineers and Development Managers
Both software development managers and software engineers should be actively involved in setting and measuring key performance indicators. Developer buy-in is critical—teams that understand why metrics matter and trust they won’t be weaponized are more likely to work toward improvement.
Co-create KPIs with your team rather than imposing them from above. Engineers often have insights into which metrics truly reflect their workflow challenges and which are gameable or meaningless. This collaborative approach also helps customize KPIs to fit your actual software development lifecycle—early-stage products might emphasize innovation velocity, while mature products might focus on reliability and maintainability.
Leverage Data for Continuous Improvement
KPIs should not just measure outcomes but also guide the path toward improvement. Modern tooling makes it easier than ever to collect and visualize KPI data:
- Use dashboards that show DORA metrics trends over time, helping identify whether changes actually improve performance
- Set up alerts for concerning trends (e.g., rising Change Failure Rate or lengthening Lead Times)
- Conduct regular retrospectives to discuss KPI trends and identify improvement opportunities
- Track the impact of specific initiatives—did adopting feature flags improve Deployment Frequency? Did adding automated testing reduce Change Failure Rate?
The goal is to create a feedback loop where KPIs inform decisions, decisions lead to changes, and you measure whether those changes had the intended effect.
Balance Breadth and Focus
While KPIs should capture meaningful data, tracking too many metrics dilutes focus and leads to analysis paralysis. Research suggests starting with the DORA four keys and adding no more than 3-5 additional metrics based on your specific context.
Every metric should have a clear owner, a target state, and regular review cadence. If you can’t articulate why you’re tracking a metric and what you’ll do if it trends poorly, remove it from your dashboard.
Encourage Transparency and Collaboration
Make KPI data visible and understandable to all stakeholders, including engineering teams and leadership. However, use metrics to improve systems, not to evaluate individuals. When developers fear metrics will be used for performance reviews, they optimize for the metric rather than for actual value delivery.
Transparency should extend to explaining the “why” behind your KPIs and being open to feedback. If engineers consistently report that a metric doesn’t reflect reality or is being gamed, listen and adjust. The best KPI frameworks evolve based on team feedback and changing organizational needs.
Conclusion
In 2025, software engineering KPIs have evolved beyond simple velocity metrics to encompass a holistic view of team performance, code quality, and developer experience. The industry has converged on DORA metrics as the foundation for measuring software delivery performance, complemented by frameworks like SPACE that emphasize developer satisfaction and well-being.
The most successful engineering organizations recognize that KPIs are tools for improvement, not weapons for evaluation. They start with the four DORA keys, establish baselines, and focus on moving up one performance tier at a time. They balance speed and stability, measuring outcomes rather than outputs, and creating cultures where transparency and continuous improvement thrive.
As AI-assisted development and platform engineering reshape how software is built, measuring the right things becomes even more critical. Elite performers distinguish themselves not by working harder but by working smarter—deploying more frequently while maintaining lower change failure rates, recovering faster from incidents, and keeping developers satisfied and productive.
Improve Your KPIs with Better Testing and Observability
Many teams struggle to improve DORA metrics because they lack visibility into how their systems behave in production and confidence in their testing practices. Speedscale addresses both challenges by capturing real production traffic and enabling teams to replay it in test environments, creating a powerful feedback loop for improving deployment frequency and reducing change failure rates.
With Speedscale, teams can:
- Increase Deployment Frequency - Gain confidence to deploy more often by testing against real production traffic patterns
- Reduce Lead Time for Changes - Catch issues earlier with automated traffic replay in CI/CD pipelines
- Lower Change Failure Rate - Test against realistic scenarios including edge cases captured from production
- Improve MTTR - Quickly reproduce production issues in development environments using captured traffic

Ready to improve your software delivery KPIs? Get started with a free trial and see how Speedscale can help your team achieve elite performance levels with better testing, faster debugging, and unprecedented visibility into your systems.