How to Do Full-Text Search Across All Application Traffic with Speedscale
Overview
Modern DevOps observability tools are excellent for monitoring system health, tracking distributed traces, and aggregating metrics. However, they lack the fidelity needed for full-text search across application traffic. While observability platforms excel at showing what happened and when, they often fall short when you need to find where a specific piece of data (like an email address, user ID, or transaction token) appears as it flows through your entire application stack.
Speedscale’s full-text traffic search solves this gap by enabling you to instantly search across all recorded network traffic, all without needing prior instrumentation, tracing, or logging. Unlike traditional search tools that only work on human-readable text, Speedscale searches both readable content and wire-format binary protocols including gRPC, Postgres, MySQL, MongoDB, RabbitMQ, Kafka, and others. Speedscale automatically decodes these binary formats into searchable text, and even opens encoded content like JWTs to search deep into claims and other nested structures. This capability is invaluable for debugging because it lets you trace data flows across service boundaries, investigate production incidents retroactively, and understand how specific values propagate through your system even when you didn’t anticipate needing to search for them.
Watch this video to understand more.
What Problem This Solves
Traditional observability tools require:
- previously defined traces
- specific log fields
- planned annotations
But during real incidents:
- you can’t predict what data you’ll need
- you can’t log everything
- encoded or binary data is hard to inspect
Speedscale solves this by recording real network traffic and making it fully searchable.
What Speedscale Can Search
Speedscale automatically:
- Records network traffic (Layer 7)
- Decodes and normalizes protocols into JSON
- Performs full-text search, even inside encoded data
Supported decoding includes:
- HTTP headers and bodies
- JWTs (claims are decoded automatically)
- gRPC
- Kafka
- PostgreSQL / MySQL
- Other supported binary protocols
Step-by-Step: How to Search Your Traffic
** Note:** Speedscale records traffic directly from your local desktop or from remote environments such as Kubernetes and many others. Whether you’re testing locally or capturing production traffic, Speedscale adapts to your workflow.
See the Getting Started guide for full installation instructions
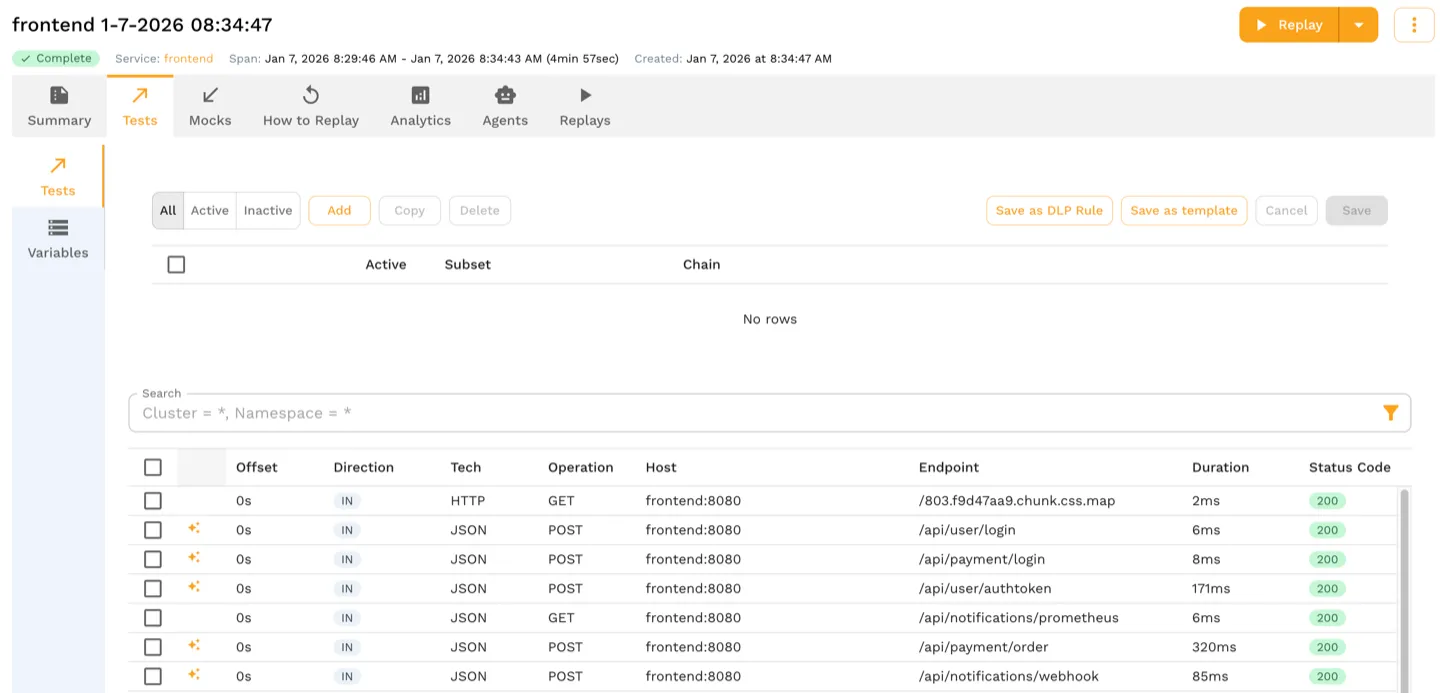
1. Record and Snapshot Traffic
- Speedscale continuously records approximately 7 days of traffic
- Select a service (e.g., frontend service)
- Save a snapshot of recent traffic (e.g., last 15 minutes)
- Takes ~30 seconds
- Inbound traffic → saved as tests
- Outbound traffic → saved as mocks
This snapshot becomes your searchable dataset.
2. Filter or Browse Requests
- Open the snapshot
- Optionally apply a basic filter (e.g., API path like
/api/payment/payment)
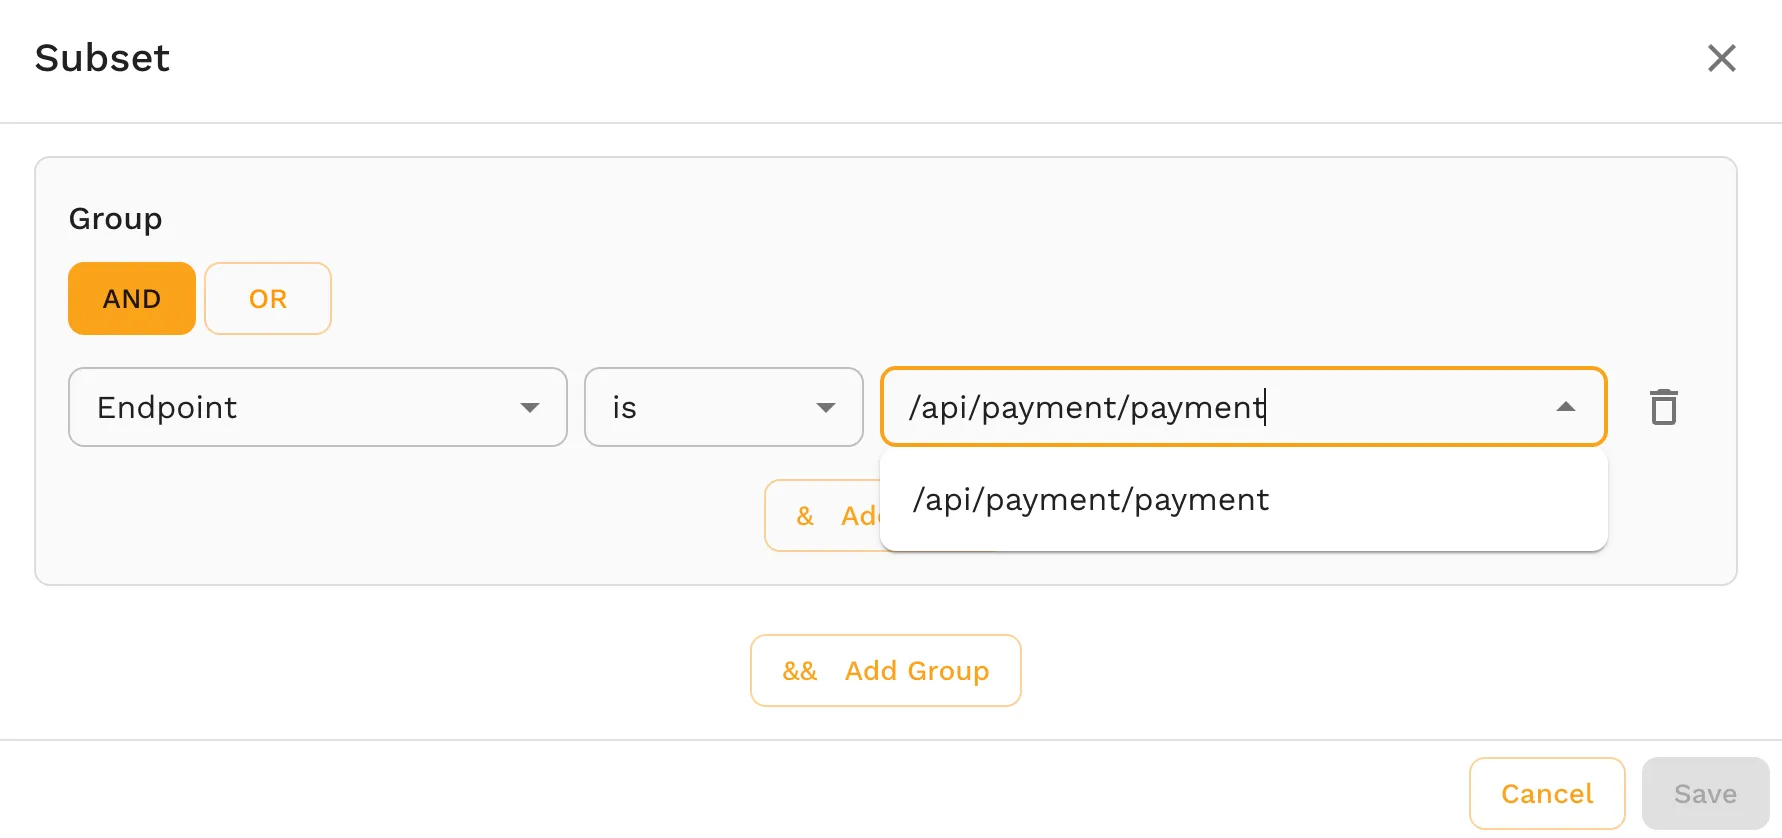
- Click any request to view the entire recorded payload
- Headers
- Body
- Encoded content (already decoded for you)
Unlike observability tools, this is actual wire-level data, not telemetry summaries.
3. Identify a Data Token
- Locate a piece of data of interest (example: an email address)
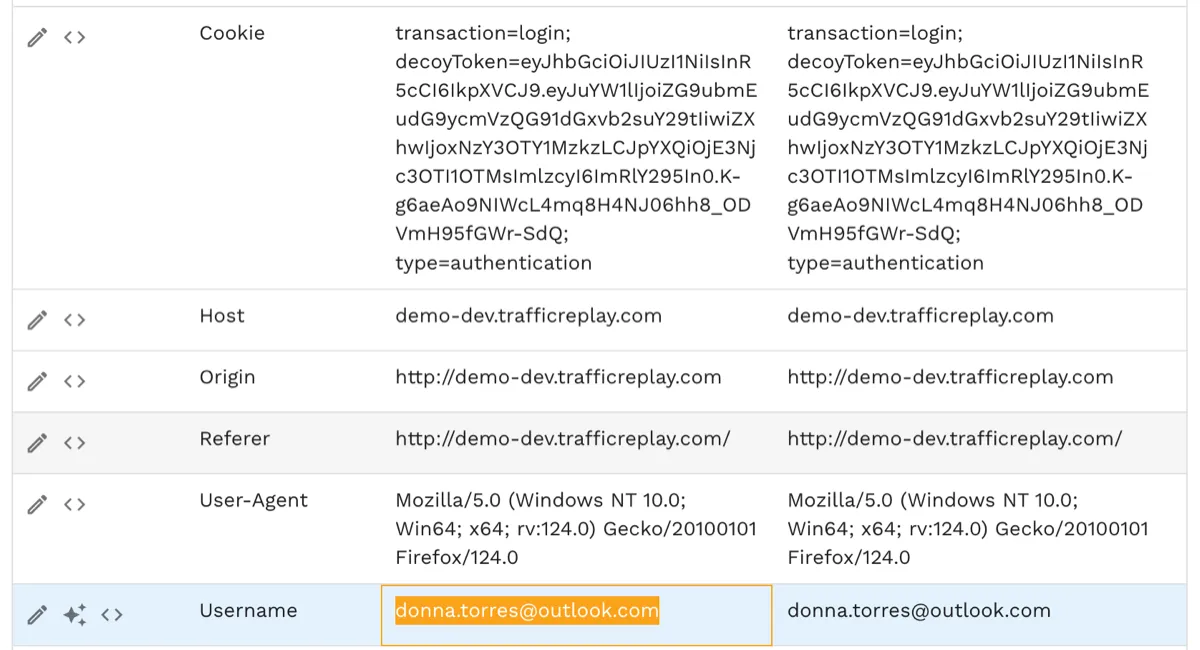
- Copy it to your clipboard
Speedscale automatically detects data patterns like:
- Emails
- Names
- Coordinates
- Other PII (≈35 data types)
It can also redact or flag PII if configured. Check the Tokens tab for example discovered data.
4. Run a Full-Text Search
- Open the Search feature
- Paste the copied data token
- Run the search across the snapshot
Speedscale will:
- Scan potentially gigabytes of traffic
- Return results in seconds
- Show every location where the data appears
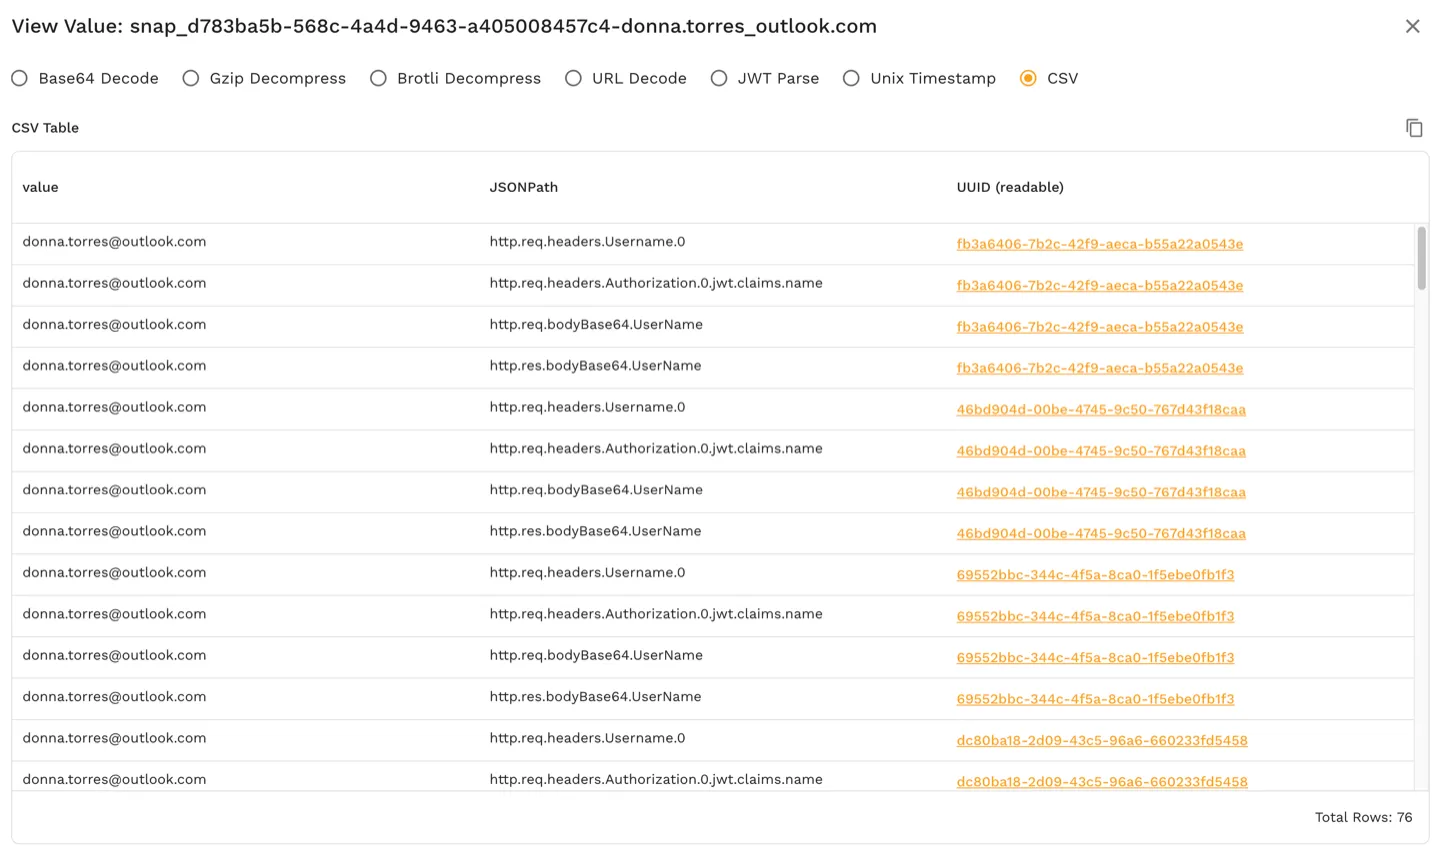
5. Understand the Search Results
Search results show:
- Which request/response pairs contain the data
- Exact locations using JSON paths, such as:
- HTTP headers
- Request body fields
- JWT claim names and values
- Encoded or binary payloads
You don’t need to:
- Decode Base64
- Parse JWTs
- Understand protocol internals
Speedscale does that automatically.
6. Investigate the Incident
- Click a matching request/response pair
- Inspect what happened in context
- Errors
- Downstream failures
- User-specific issues
Instead of:
“Which service logged this?”
You now ask:
“Where does this data flow through my system?”
This works across all services, not just a single component.
Key Takeaways
- No need for pre-planned tracing or logging
- Full-text search across real production traffic
- Works on encoded and binary protocols
- Ideal for incident response and forensic debugging
- Complements (does not replace) observability tools
Learn More
Visit https://speedscale.com to explore full-text traffic search and traffic replay.