Part 2: Building a Production-Grade Traffic Capture, Transform and Replay System
When developers try to build realistic mocks and automated tests from production network traffic, the real challenge isn’t just in the capturing—it’s in the data manipulation. Raw traffic is a chaotic sea of patterns, dynamic tokens, environment-specific secrets, and tangled dependencies that seem impossible to untangle by hand. Over my two decades of building these sytems, I learned that solving this problem requires more than brute-force parsing or ad hoc scripts. The key insight is borrowed straight from the data lake world: separate compute from storage and apply machine learning techniques. Treat traffic captures like raw data in a data warehouse—store everything cheaply and immutably, then layer on scalable compute to efficiently process, analyze, and extract those crucial data patterns. This hybrid approach lets you build robust, flexible transformation pipelines that turn unruly traffic data into high-quality, reusable mocks and tests. You can learn how Snowflake solves this problem in their Snowflake’s architecture overview.
This is the second post in a 3-part series:
- How to build a traffic capture system
- How to build a traffic transform system (you’re here)
- How to build a traffic replay system
We’ll turn raw traffic into tests, mocks, and practical recommendations you can actually use.
- Part 2 of 3. Capture gives you raw traffic. Transforming it is the hard part, and the trick is to treat captures like a data lake: separate storage from compute, store everything cheaply, then run analysis on top.
- The work is tokenization (find timestamps, UUIDs, JWTs, secrets), redaction so data can leave prod, and a dependency graph (we call ours “squiddy”) to decide what to replay versus mock.
- Keep transforms external to the data. They’re rules in version control, not edits to the payloads, so you can re-run them on fresh captures and review them like code.
- Referential integrity is the trap. If you anonymize an email in a test, the mock database has to accept the new value too, so transform tests and mocks together with the same rules.
Why Transform Network Traffic?
Traffic analysis reveals that transformation turns noisy, environment-specific network traffic into stable, portable artifacts you can reuse.
- Make replay deterministic: replace timestamps, UUIDs, and tokens so runs are repeatable.
- Improve portability: adapt prod-shaped traffic to dev/CI/staging URLs, auth, and schemas.
- Enforce safety: redact secrets/PII so captured data can leave production, ensuring high-quality data.
- Evolve contracts: reshape payloads as APIs migrate without rewriting tests from scratch.
- Design better tests: parameterize inputs to explore edge cases and performance windows.
- Reduce flakiness: normalize ordering, defaults, and types so validations don’t drift.
Why Traffic Analysis Matters Before Transforming
Before we jump into the how, here’s what good traffic analysis buys you:
- Indexing: There’s always more data than you think. If you can’t find it fast, it’s not useful.
- Dependency Graph: Upstream/downstream maps reveal what really talks to what (our internal diagram is affectionately called “squiddy”).
- Tokens: Timestamps, auth headers, UUIDs—little landmines that make replay flaky unless you normalize them.
- Data Loss Prevention: Redact PII and secrets so traffic can safely leave prod and be used in test.
- Recommendations: Turn observations into concrete transform rules that make replay deterministic.
- Metadata: Who/what/where/when—boring but essential for search, routing and reproducibility.
- Prediction: A solid traffic model lets you forecast how the app will behave under change.

What You’re Analyzing: Network Traffic and Raw Data Sources
Traffic analysis typically works with request/response pairs captured from your system as raw data—the original source data collected from various inputs:
- HTTP/S requests and responses (headers, bodies, status codes)
- Text responses like JSON, GraphQL and XML
- Binary responses like gRPC and protobuf
- Database queries and result sets
- Message queue producer and subscriber payloads
- Metadata such as cluster, namespace, workload, timestamp
The goal is to extract meaning from these interactions and transform them into structured data suitable for testing and analysis.
Traffic Analysis Techniques
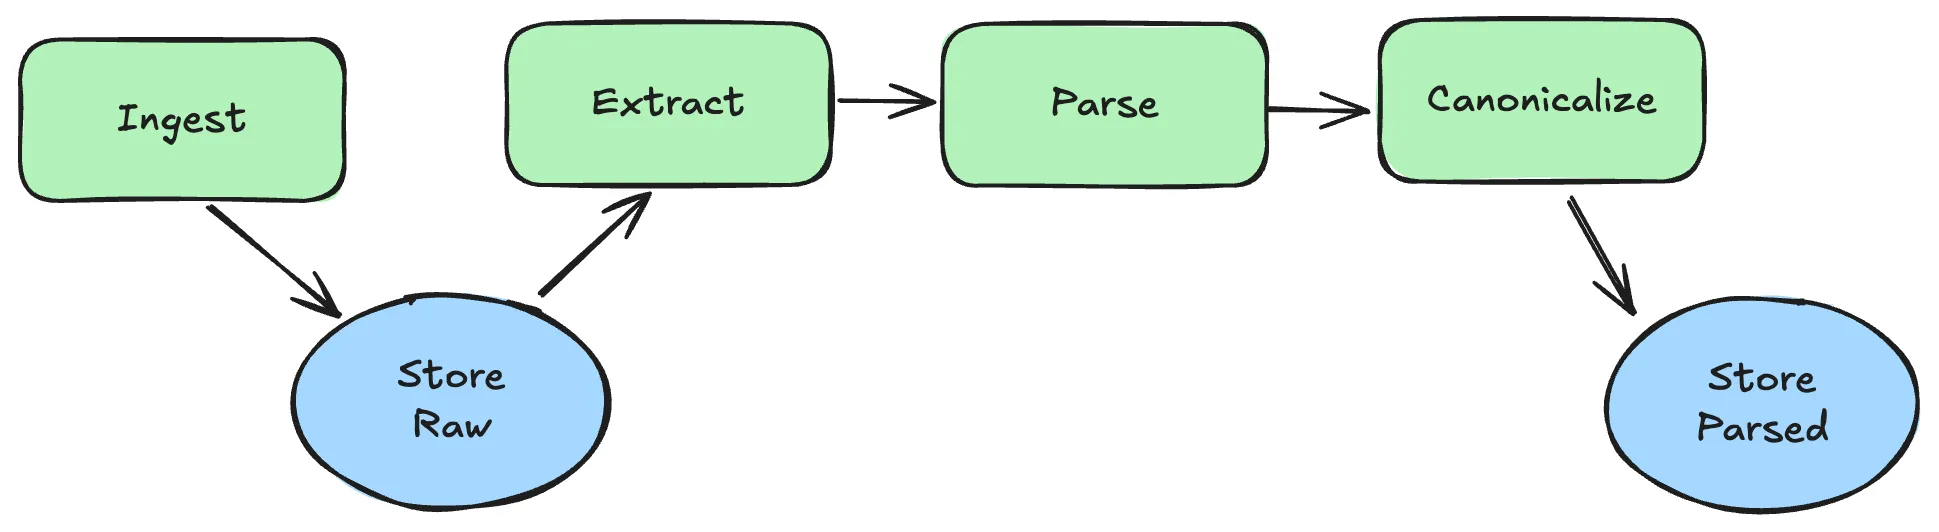
Parsing and Data Normalization for Network Traffic
Make all traffic look consistent so downstream logic stays simple. Data normalization is essential for converting unstructured data into a standard format:
- Normalize line endings, encodings, and decompression (respect
Content-Encoding). - Canonicalize HTTP: lowercase header keys, split multi-value headers, extract cookies.
- Preserve both raw and parsed forms so you can re-emit exact requests later.
- Parse payloads into typed trees when possible (JSON, XML, GraphQL, protobuf), converting unstructured data into structured data:
- JSON/XML: produce a structural tree with stable key ordering.
- GraphQL: extract
operationName,variables, and derived field paths. - Protobuf/gRPC: decode using service descriptors, fall back to hexdump when unknown.
- Databases: parse the request (statement/query) and the response (result set/object):
- SQL (Postgres/MySQL): capture full statement and bound parameters; normalize whitespace/casing; parameterize literals; decode wire protocol when possible; record result set schema and representative rows.
- NoSQL (Mongo/Elasticsearch/Redis): capture operation shape (filter/projection/sort or command), normalize key ordering, store field/value triples, and persist returned documents or hit summaries.
- Message queues/streams (Kafka, SQS, Pub/Sub):
- Kafka: topic, partition, offset, key, headers; decode values via Schema Registry (Avro/Protobuf/JSON); preserve ordering keys and compaction semantics.
- SQS/Pub/Sub: message attributes, delivery timestamps, ack IDs, de-duplication IDs, and ordering keys/FIFO; normalize into a common envelope for downstream rules.
Indexing Network Traffic for Fast Lookups
You’ll query traffic constantly during traffic analysis, so invest in the right indices:
- Time index: window queries (e.g., last 15 minutes) and retention policies.
- Path index: trie or prefix index over paths (
/users/:id/orders). - Header index: inverted index for common headers (auth, correlation IDs, content type).
- Token index: every detected token (UUIDs, timestamps, JWTs) with backrefs to locations.
- Service/Workload index: group by cluster/namespace/workload for blast-radius queries.
- Layer 7 Request and Response Bodies: Break request and response bodies into key=value pairs that can be vectorized.
Tip: keep metadata (small, hot) separate from payload blobs (large, cold). Metadata goes in a fast KV/column store; payloads live in object storage with content-addressed keys.
Metadata and Provenance to capture alongside indices:
- Source: cluster, namespace, workload, version/commit, pod, region/zone.
- Timing: capture window, request/response durations, retries, backoffs.
- Routing: ingress/gateway, service mesh, load balancer decisions.
- Identity: user/tenant hints, auth method (JWT/OIDC/API key), correlation IDs.
- Storage pointers: object keys for raw payloads, content hashes, schema versions.
Key Takeaway: Treat metadata as a first-class product. It powers search, routing, and reproducibility.
Token Extraction in Traffic Analysis
Detect tokens that make data dynamic between runs during traffic analysis. In machine learning we refer to this as applying classifiers. Unlike typical vectorization problems these types of classifiers often span multiple data types and request/response interactions. For example, detecting a JWT is a relatively simple classifier. However, understanding an OAuth interaction using a JWT and determining all the places it is mutated and used is an entirely diffent level of complexity. Here are some basic classifiers you’ll need:
- Deterministic regex/format detectors: ISO-8601 timestamps, UUIDv4, ULIDs, emails, IPs.
- Semantic detectors: JWT structure and claims, base64 payloads, credit cards (Luhn).
- Entropy-based detectors: high-entropy substrings likely to be secrets or IDs.
- Domain-specific detectors: order IDs, tenant IDs, customer numbers, SSNs.
Example tokenization record emitted per request/response:
{
  "path": "/checkout",
  "method": "POST",
  "tokens": [
    {"name": "timestamp", "kind": "iso8601", "value": "2025-10-16T12:34:56Z", "locations": [{"body": "/createdAt"}]},
    {"name": "requestId", "kind": "uuid_v4", "value": "7d9b1e7f-0f22-4a2d-a2d2-6a3c7f9e9a4b", "locations": [{"header": "X-Request-Id"}]},
    {"name": "jwt", "kind": "jwt", "value": "eyJhbGci...", "locations": [{"header": "Authorization"}], "claims": {"sub": "user-123", "exp": 1760892345}}
  ]
}
Data Quality and Loss Prevention
Balance recall and precision: false negatives leak; false positives frustrate users. Maintaining data quality throughout the transformation process is critical for ensuring reliable test and mock data. Most production environments do not allow data export, or at least they shouldn’t. So before you migrate data out of your secure production systems you probably want to anonymize it. Unfortunately, simple anonymization doesn’t often work with traffic replay because data fidelity matters. One approach I frequently use is to use data classifiers to describe the “shape” of the data and then during replay replace the anonymized value with a value of the same “shape.” For example, when exporting data you might anonymize customer numbers but instead of inserting a blank string you instead you insert a regex describing what was found across all production requests for this type of value. This is why data classifiers and indexing can be so instrumental across the lifecycle.
- Layered approach: exact regexes → ML/NLP classifiers → human overrides.
- Context awareness: key names (
ssn,cardNumber), field neighborhoods, length/format. - Redaction policies: irreversible mask vs. reversible tokenization.
- Auditability: record what was redacted, why, and by which rule version.
Sample policy sketch:
pii:
  detect:
    - regex: "\\b\\d{3}-\\d{2}-\\d{4}\\b"
      label: ssn
    - regex: "\\b4[0-9]{12}(?:[0-9]{3})?\\b" # Visa
      label: credit_card
    - entropy: ">4.0"
      label: high_entropy
  redact:
    ssn: "XXX-XX-XXXX"
    credit_card: "**** **** **** ****"
    default: "[REDACTED]"
Correlation and Sessionization of Network Traffic
Group related requests so you can reason about flows:
- Use trace IDs,
X-Request-Id, cookies, and IP+UA heuristics when traces are missing. - Build sessions with idle timeouts; maintain parent/child relationships across hops.
- Derive flows like:
frontend → api-gateway → usersvc → paymentsvc → postgres.
Leverage OpenTelemetry to propagate trace context across services (W3C traceparent/tracestate). Instrument both inbound servers and outbound clients so trace IDs flow automatically.
// Minimal OTEL example: inbound handler + outbound client with context propagation
import (
    "net/http"
    "go.opentelemetry.io/contrib/instrumentation/net/http/otelhttp"
)

var client = &http.Client{Transport: otelhttp.NewTransport(http.DefaultTransport)}

func main() {
    mux := http.NewServeMux()
    mux.Handle("/users", otelhttp.NewHandler(http.HandlerFunc(func(w http.ResponseWriter, r *http.Request) {
        // Outbound call uses the same context; W3C trace headers are injected automatically
        req, _ := http.NewRequestWithContext(r.Context(), http.MethodGet, "http://payments:8080/health", nil)
        _, _ = client.Do(req)
        w.WriteHeader(http.StatusOK)
        _, _ = w.Write([]byte(`{"ok": true}`))
    }), "users"))
    _ = http.ListenAndServe(":8080", mux)
}
Tips:
- Set
service.nameconsistently per app so traces group cleanly. - If you also log
X-Request-Id, include it as a span attribute for easy cross-reference.
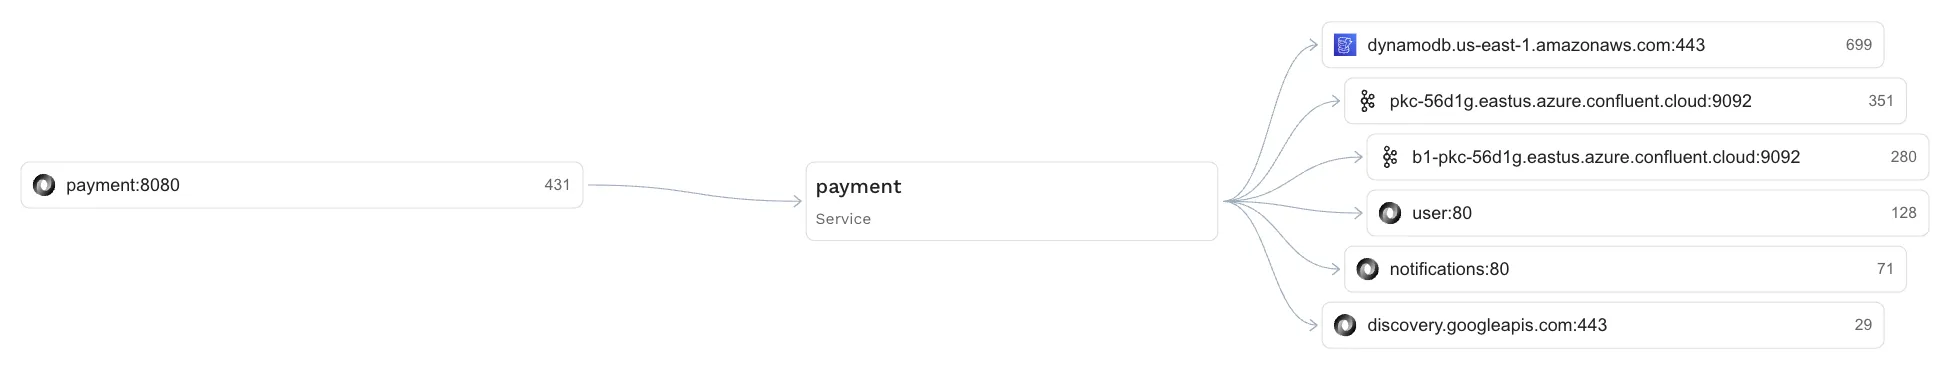
Dependency Graphs from Traffic Analysis
Emit a service dependency graph to inform test isolation and mocking based on traffic analysis:
- Nodes: services, databases, queues, third-party APIs.
- Edges: call counts, error rates, P95 latency, payload shapes.
- Enrich with endpoint-level stats so you can target high-traffic/high-risk edges first.
This graph becomes the backbone for choosing what to replay vs. what to mock.
Recommendations to Transform Rules
Convert traffic analysis into actionable rules the transform/replay engine can apply:
- Mask secrets: headers
Authorization, cookiessession, bodies/password. - Replace nondeterministic values: timestamps →
now(), UUIDs →uuid(). - Parameterize inputs: lift
userIdfrom query/body so tests can inject values. - Synthesize stable IDs: map production IDs to synthetic but consistent test IDs.
Example rule bundle:
rules:
  - when:
      method: POST
      path: ^/orders$
    actions:
      - mask:
          header: Authorization
      - replace:
          jsonPointer: /orderId
          with: uuid()
      - parameterize:
          from: body.userId
          as: userId
  - when:
      path: ^/users/[^/]+/profile$
    actions:
      - redact:
          jsonPointer: /ssn
      - replace:
          jsonPointer: /phone
          with: faker.phoneNumber()
Stateful Transforms (Simple Cart Example)
Sometimes you need to carry data from one request to a later one. A common case is creating a resource, getting back an ID, then using that ID in a follow-up call.
Cart flow (two calls):
- Client creates a cart and receives
cartIdfrom the response. - Client updates the cart status using that
cartIdin the URL.
Minimal example payloads:
// 1) Create cart (response)
{
  "status": 201,
  "body": {"id": "c_12345", "items": []}
}
# 2) Update cart (request)
PUT /carts/c_12345 HTTP/1.1
Content-Type: application/json
{"status": "CHECKOUT_PENDING"}Key ideas:
- Extract-and-store: read
idfrom the first response and save it in flow/session context. - Substitute-on-send: when the next request template is
/carts/{id}, replace{id}with the stored value. - Guardrails: if no
idwas captured yet, skip, retry, or synthesize a deterministic placeholder and log a warning.
This statefulness lets replay mimic real user flows without hardcoding IDs into fixtures.
Scoring and Confidence
Each recommendation should include a confidence score and rationale so humans can review risky changes. Track acceptance/rejection feedback to continuously learn better rules for your domain.
Prediction and Modeling cues for prioritization:
- Contract drift: detect schema/shape changes by endpoint over time.
- Latency and error envelopes: establish expected bands (p50/p95) per endpoint.
- Impact analysis: “If I change usersvc, which downstreams will squeal?”
- Replay hints: which tokens must be transformed to keep responses stable.
From Traffic Analysis to the Data Transformation Process
Once your traffic analysis tool has extracted tokens, rules, and a dependency graph, you can generate artifacts in the target format required by your testing infrastructure:
- Test suites: group sessions into realistic user flows; parameterize with detected inputs.
- Mocks and datasets: emit stable, redacted fixtures for services you choose not to hit.
- Environment manifests: which edges to replay vs. stub per environment (dev, CI, perf).
These artifacts enable you to transform raw source data into the specific format and structure required by downstream systems, ensuring data consistency and compatibility.
Minimal transform application sketch over a captured request:
{
  "request": {
    "method": "POST",
    "url": "/orders",
    "headers": {"Authorization": "[MASKED]"},
    "body": {"orderId": "3f0c8e4a-8b63-4a2c-a0d9-efc4a3f3a1b1", "userId": "${userId}"}
  }
}
Keep Transforms Outside the Data
Transforms are rules about data—not the data itself. Keeping them external yields two wins:
- Re-runs are comparable: apply the same transform set to fresh captures to verify correctness.
- Safer review: transforms live in version control, separate from large opaque payload blobs.
How to store and manage transforms:
- Use small, text-based artifacts (YAML/JSON/TS) under source control near tests.
- Group by intent (mask, replace, parameterize) and by domain (auth, orders, carts).
- Version explicitly: add rule IDs, changelogs, and semantic versioning for bundles.
- Test continuously: keep golden inputs and snapshot before/after payloads in CI.
- Promote like code: publish signed bundles for dev → CI → staging with review gates.
- Observe usage: collect rule hit counts and errors to prune dead or risky rules.
Operational tips:
- Prefer configuration over embedded code so changes don’t require rebuilds.
- Keep environment deltas tiny: a base bundle with small per-env overrides.
- Document ownership per bundle to avoid drift across teams.
Traffic Replay has Unique Challenges
Creating reliable tests and mocks requires analyzing them together rather than in isolation. For example, if your test data includes a user’s email address and you plan to fuzz or randomize that email for edge cases, your simulated (mocked) database or backend must also recognize and accept these newly-generated email addresses. Otherwise, lookups, authentications, or object relationships in the tests will fail unexpectedly. If you simply update test cases to use anonymized values but forget to propagate those same values to your database fixtures, you introduce subtle bugs. This synchronization is best handled via automation: transform both tests and mocks in a coordinated way—ideally using the same set of rules—rather than relying on brittle scripts or manual interventions. Tools that orchestrate updates across captured data, test cases, and mock databases can ensure referential integrity and realism, while reducing the chances of mismatches that might otherwise escape detection until runtime.
Here are a few more tips:
- Simple find/replace in both the test and mock data can go a long way to solving integrity issues
- Some databases have proprietary or copyrighted protocols (lookin’ at you Oracle). Check out Test Data Management for solutions to legacy systems that are not open source or can not be reliably simulated.
- Data changes shape based on where you find it in the system. For example:
- a user name might appear in the login transaction and also embeded in the claims of a JWT… but you don’t know that unless your classifier decodes JWTs
- timestamps may be relative like Last 7 days and you need to know how to mutate those reliably
- data is often hidden within binary protocols like Postgres result sets
- Remember that in a scaled system your mock needs to understand how to maintain data integrity across instances or deal with real world scaling issues reliably
- Chaos engineering is typically thought of as an infrastructure game, but with this approach you can inject some chaos into specific transactions (engineers love hunting down off by one errors, for instance)
Observability and Debugging
You can’t fix what you can’t see. Make transforms observable during development and CI:
- Structured logs: record which rules fired, what fields changed, and any redactions applied.
- Diff views: for selected samples, emit compact before/after snippets of headers and JSON body.
- Dry-run mode: apply rules and report would-be changes without mutating outputs.
- Correlation: include trace/request IDs so logs tie back to specific flows and sessions.
- Metrics: counters for rule hits/misses and error rates; latency histograms if transforms run inline.
Example before/after snapshot (truncated for clarity):
{
  "path": "/orders",
  "before": {"headers": {"Authorization": "Bearer eyJ..."}, "body": {"orderId": "ab12"}},
  "after":  {"headers": {"Authorization": "[MASKED]"}, "body": {"orderId": "3f0c8e4a-..."}},
  "rules": ["mask.authz", "replace.orderId.uuid"]
}
Operational tip: sample snapshots (e.g., 1 in 1,000) to keep logs small while retaining debuggability.
Testing Transforms
Treat transforms like code: test them.
- Golden tests: fixed inputs → expected outputs stored alongside rules.
- Snapshot tests: human-reviewed diffs for complex payloads with stable keys/ordering.
- Negative tests: missing tokens, malformed payloads, or rule conflicts should fail predictably.
- Determinism: seed any random generators so outcomes repeat in CI.
- Contract checks: detect if upstream schema changes would bypass a rule.
Lightweight harness pattern:
- Put test vectors in a
tests/folder near the transform bundle. - Run them in CI on every change; export a small HTML diff report.
- Fail fast on new redactions that touch disallowed fields.
Scalability and Data Quality Considerations
As traffic volume grows, your traffic analysis tool and transformation process must scale efficiently. Modern data transformation tools leverage distributed computing and optimized storage to handle massive data sets:
- Separate storage from compute: Keep raw traffic in cheap object storage (data lake), metadata in fast stores, and spin up workers on demand.
- Data quality checks: Implement validation, cleansing, and normalization to address missing values, duplicate data, and inconsistent data types.
- Parallel processing: Transform multiple traffic sessions concurrently to maintain throughput.
- Incremental updates: Process new traffic without reprocessing the entire capture set.
Reliable data transformation processes ensure that your test and mock artifacts are consistent, trustworthy, and ready for replay.
What to Build First
- Normalize HTTP + JSON; store raw and parsed payloads.
- Token detectors for timestamps, UUIDs, JWTs; header/body indices.
- Basic PII rules for obvious fields; reversible tokenization for IDs.
- Dependency graph per service; top N endpoints by traffic.
- Rule engine that can mask/replace/parameterize; YAML/JSON rule format.
Wrapping Up
Transforming captured traffic into actionable artifacts hinges on great traffic analysis: fast indices, high-signal token/PII detection, a clear dependency graph, and a pragmatic rule engine. With these pieces in place, you can safely generate tests and mocks that behave like production without the risk.
In Step 1: How to build a traffic capture system, we covered how to intercept and record production traffic. Now that you know how to use traffic analytics to transform that raw data into stable, portable artifacts, you’re ready for Step 3: How to build a traffic replay system - where we’ll put this transformed traffic to work validating your services.
Common questions
What does it mean to transform captured traffic?
Transforming turns noisy, environment-specific traffic into stable, portable artifacts. That means normalizing formats, replacing nondeterministic values like timestamps and UUIDs so replay is repeatable, redacting secrets and PII so data can leave production, and parameterizing inputs so tests can inject values.
How do you keep traffic replay from being flaky?
Find and normalize the dynamic tokens. Detectors catch ISO-8601 timestamps, UUIDs, JWTs, and high-entropy secrets, and transform rules replace them (timestamps to now(), UUIDs to uuid()). The hard cases span multiple requests, like a JWT that gets mutated across an OAuth flow, so the classifier has to decode and track it.
How do you safely use production data in tests?
Redact at transform time with a layered approach: exact regexes, then ML or NLP classifiers, then human overrides. For fidelity, instead of blanking a value you can replace it with one of the same shape, so a redacted customer number still looks like a customer number during replay.
Where should transform rules live?
Outside the data. Transforms are rules about the data, not the data itself, so keep them as small text artifacts (YAML or JSON) in version control near your tests. That makes re-runs comparable, keeps review safe, and lets you promote rule bundles from dev to CI to staging like code.