
Measuring throughput and latency is a critical step in load testing software to ensure application performance and stability. In this article, we’ll discuss essential considerations before beginning performance testing and provide a detailed, step-by-step guide on leveraging production traffic replication in Kubernetes. This approach helps you accurately determine your software’s maximum throughput during performance testing.
Throughput is a measure of how many requests your web application can handle over a period of time, and is often measured in transactions per second (TPS). A proper load testing and stress testing or performance test plan typically tracks throughput and other performance metrics like average response time, concurrent users, and error rate. Grasping the performance testing process, especially aspects like throughput, provides clearer insights into the required network bandwidth to support your users. It also guarantees that your web application possesses the necessary capacity to manage expected or peak traffic loads efficiently.
What is Throughput in Performance Testing?
Throughput in performance testing refers to the rate at which a system or application processes requests or transactions within a specified time frame. It is a critical metric that helps evaluate the performance and scalability of a system, ensuring that it can handle a large volume of data and user traffic. Throughput is often measured in transactions per second (TPS) or requests per second, making it a key performance indicator (KPI) in performance testing. By understanding throughput, performance testers can gauge how well an application can serve its users under various load conditions, ultimately ensuring a smooth and efficient user experience.
Understanding Throughput in Real-World Scenarios
To grasp the concept of throughput, consider real-world scenarios. For instance, a web application’s throughput can be visualized as the number of users it can handle simultaneously without compromising performance. Similarly, network throughput can be seen as the amount of data transmitted within a given time frame. These real-world examples help performance testers design more effective tests and set realistic system performance goals. By simulating actual usage patterns, testers can better predict the system’s performance under different conditions, ensuring it meets user expectations and business requirements.
The Importance of Measuring Max TPS in Performance Testing
Understanding your software’s maximum TPS helps engineering managers gain confidence in the system’s ability to keep processing requests and avoid unexpected downtime and network latency.
Determining the maximum TPS also helps engineers and engineering managers decide on which optimizations to prioritize or what changes are needed to accommodate future changes or events. Running tests to determine max TPS will reveal whether the infrastructure and applications can handle this and what parts may require optimizations. An expected 20% growth may have teams modify auto-scaling rules to spin up 20% more instances, which neglects to verify whether new instances can spin up fast enough.
The many factors influencing scale-up time and readiness require thorough testing to simulate what will happen in production. This testing also creates an understanding of software application behavior, removing the fear of spikes and allowing you to size pods with the required capacity and appropriate headroom to avoid overprovisioning and reduce costs. Performance testing aims to ensure the optimal functioning of software applications, identifying and resolving issues before they impact users, thereby enhancing the overall effectiveness and readiness of the software.
Key Considerations for Determining Max Throughput
When executing software testing, a performance test, and determining your max TPS, it’s vital to consider several factors, such as ramp patterns, sustained TPS, and spike TPS.
Ramp Patterns
Setting an improper ramp time can undermine the accuracy of any TPS test. Application behavior can vary wildly based on on how traffic ramps up or tails down, revealing different failures under varying patterns of user load.
Consider Ticketmaster putting new tickets on sale. Focusing solely on sales for a popular artist might result in overly sensitive autoscaling rules, causing overprovisioning. On the other hand, testing only for lesser-known artists could lead to inadequate autoscaling.
Testing with various network speeds and patterns of traffic growth can reveal whether diverse scenarios require adjustments to the underlying resources. For e.g., utilizing more expensive, high-capacity nodes for concerts featuring popular artists may be wise. Gaining insights into data processing is vital for optimizing throughput, pinpointing bottlenecks, and maintaining uniform user experiences.
Sustained TPS
Testing with sustained TPS increases the likelihood of catching certain types of errors, like memory leaks, caching issues, and transient faults. For instance, deadlocks happen when two or more processes are waiting for each other to release resources, and race conditions happen when multiple processes try to access the same resource at the same time.
Both failures can happen immediately but are more likely to fail under a sustained load, especially in distributed systems. Testing with sustained TPS can also reveal cases of resource exhaustion, like reaching the maximum number of concurrent database connections by not terminating connections after use. In such scenarios, the throughput stays fairly consistent, indicating stable performance levels during user activity.
Spike TPS
Evaluating sudden traffic surges can yield valuable insights, as these often occur in real life due to new product launches, successful marketing campaigns, or breaking news coverage.
Invoking spike transactions per second (TPS) during testing can simulate real-world events, providing a comprehensive understanding of your application. This method helps accurately assess response times under various load conditions, determine how quickly infrastructure stabilizes after stress, and estimate recovery times from crashes caused by high throughput. The concept of spike testing is similar to real-life situations such as fast food stalls or gas stations, where a constant maximum capacity leads to queues when demand exceeds available resources.
Spike TPS can also be valuable in continuous integration. Engineering teams might find hour-long tests for each pull request inefficient and instead opt for quick validations using spike TPS. Subsequently, they can employ realistic ramp patterns and sustained TPS in preparation for new releases.
Correlating TPS with Other Key Metrics
While monitoring TPS during testing is beneficial, the most insightful revelations come from correlating transactional throughput with resource consumption patterns. Take a look at these graphs from Speedscale’s dashboard:
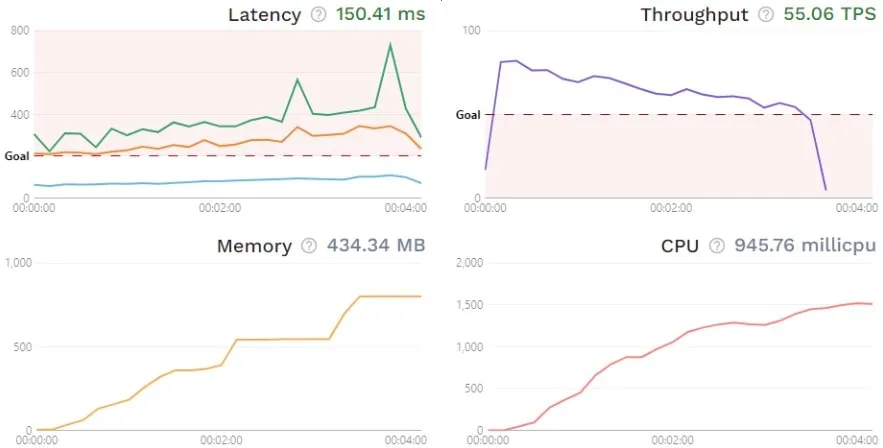
Speedscale dashboard showing throughput, latency, memory, and CPU
Here, throughput decreases and latency increases over time, alongside a steady rise in memory and CPU usage, with notable spikes in the latency 99th percentile (green line) near the performance test’s end. Proper insights from endurance testing are impossible without a full understanding of the application being tested; however, this data clearly indicates that engineers may want to investigate resource utilization. A comprehensive performance report that analyzes multiple metrics, including throughput behavior and other resource consumption factors, is essential for thorough evaluation.
In other words, monitoring TPS is useful for understanding how different load conditions affect the user experience, but bug fixes require you to correlate it with application and infrastructure metrics.
Configure the Right Tests by Understanding Your Goals
Testing throughput and understanding your throughput goal and the reasoning behind them can help configure the right test plan for the best results. For example, a media website may want to identify a breaking point to prepare for upcoming breaking news coverage. This would likely mean preparing for a very sudden influx of traffic with spike TPS, and a quick ramp-up pattern. Additionally, the media website may want to test the performance of a breaking news during peak operating hours, which would require them to ‘warm up’ the service with sustained load beforehand.
Using Production Traffic Replication for More Accurate Load Testing
A deeper understanding of your system processes and users enhances the accuracy of your tests, resulting in more reliable software. Today, more software teams are turning to production traffic replication to simulate their production environment and understand the real-world usage of their software. Optimizing the web server during these performance tests is crucial to ensure overall system performance, resilience, and user satisfaction.
Step-by-step guide for determining max throughput with production traffic replication
This section showcases how to use production traffic replication to accurately determine the max TPS of your application in Kubernetes, implementing the features found in Speedscale. Prerequisites: Set up and install Speedscale, or explore the interactive demo.
Step 1: Create your own test config
Tests in Speedscale are always done by executing a traffic replay. All traffic replays need a test config defining the behavior of the load generation, which you can create from scratch, or clone and modify an existing one. For this tutorial, copy the “standard” configuration and name it “sustained-tps”. 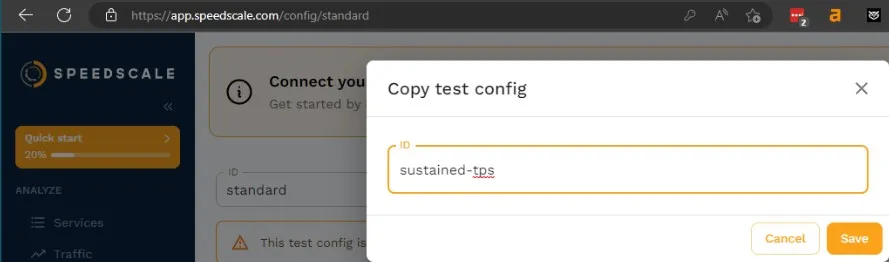 Now, go to the “Load Pattern” tab and edit the existing stage by clicking the pencil icon.
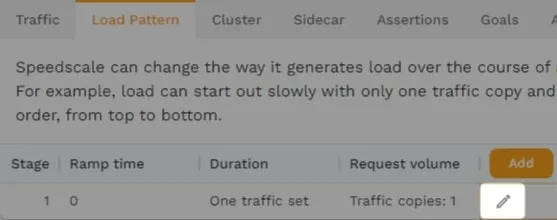
Change the “Duration” to be a fixed time of 300 seconds (5 minutes) and ramp time to 30 seconds. In a real test, make sure that these options accurately reflect production behavior.
Set TPS to 100. The load generation algorithm is auto-tuning and will back off if the application cannot keep up. Because of this, you can in theory set the TPS to be anything—like 10,000—when performing stress tests, just make sure it’s higher than what you expect your application can handle. Now, click “Ok” to save the stage. 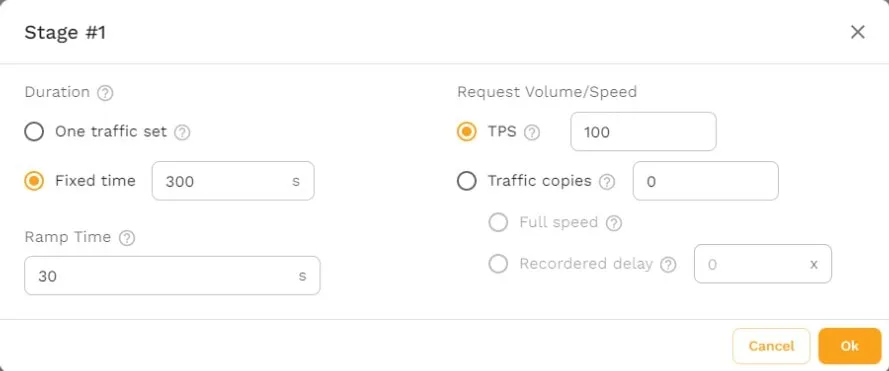 For the sake of simplicity, this guide will refrain from modifying other options like “Goals” and “Assertions”, however, you’ll want to set those during real tests. For now, you can view them in your own installation or in the demo. Note that “Goals” and “Assertions” are different in that they are concerned with metrics and requests respectively.
Step 2: Execute a traffic replay
Assuming you’ve already created a snapshot, you can now replay it as a test from the snapshot overview in your installation. 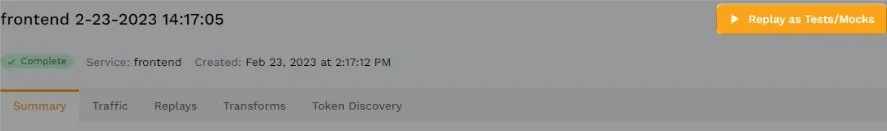 You can also execute a traffic replay with the speedctl CLI tool: $ speedctl infra replay —test-config-id sustained-tps —snapshot-id
Step 3: Analyze the report
 Once the replay is done and the results have been analyzed, you’ll be presented with an overview of the latency, throughput, memory usage, and CPU usage, with an additional latency summary by endpoint below. This overview alone should provide a high-level understanding of how your application performs, and how that performance correlates to resource usage. The “Success rate” tab provides insight into how well the responses from the service under test align with what’s recorded from production. Here you can dig into the actual resiliency of the application under various load conditions. Lastly, the “Mock responses” tab shows how many outgoing requests were sent to the mock server, a very useful feature within the tool.
Increase efficiency with automatic mocks
By default, all test configs in Speedscale utilize automatic mocks to isolate the Service-Under-Test (SUT). In practical terms, a new Pod is spun up as a mock server and the sidecar proxy then redirects traffic to the new Pod. This avoids depending on third-party dependencies that may be rate-limited and ensures realistic input during testing from both the user and the dependencies, while retaining the realism of inter-Pod communication.
How load testing and service mocks work together
Read The Blog This automatic approach to mock servers is essential in creating realistic tests, as well as in other use cases like preview environments.
Get started with Speedscale
By now, it should be clear why max TPS is such a valuable metric to determine, and why it’s not as simple as just ramping up traffic until your application breaks. From here, you can explore the different possibilities with test configs and start validating your own applications. One possibility is to utilize multiple stages and maintain a sustained TPS for a set amount of time, then induce spike TPS with another stage to determine application behavior if traffic surges during normal operations—like sudden news coverage. Once you’ve determined your testing methodology, you’ll likely want it implemented in a continuous manner, so you can catch errors early in your development process.