There was a big announcement this year at GrafanaCon 2021 that performance testing tool k6 is being aquired by Grafana Labs. It was really exciting news for folks who cheer for open source because these are two giant projects. At time of this writing, k6 has over 12K stars and Grafana with a respectable 42K stars on Github as well. In full transparency, I have used both of those repos many times over the years and am a fellow stargazer. Here is a great quote from Grafana Labs CEO Raj Dutt:
These days, compute and microservices are available on demand, so it is far less costly to run test simulations. Because k6 is open source and also has a cloud offering, developers can realize the benefits much more rapidly. By bringing k6 and Grafana together, we enable teams to radically improve the time to prevent, detect, and remediate problems before they impact end users.
It is interesting that Raj is looking at this from multiple different perspectives:
- Compute on demand makes it easier than ever to run test simulations
- With both open source and cloud offerings, developers have multiple options for how to run these tests
- The synergy is related to Grafana users finding issues before they impact end users (i.e. shift-left)
Let’s dig into each of these trends to understand this in more detail.
Compute on Demand
It’s not just the cloud, but all kinds of compute costs have been plummeting for years. I’m editing this blog on a Macbook Pro with 32 GB of RAM (roughly how much you need to run Chrome these days). Anyway this is an obviously well known trend, but one of the interesting findings is that doing performance related work is becoming cheaper. Perhaps you don’t need an enormous multi-million dollar replica of production to run a load test, maybe you can string together some open source bits and some ephemeral cloud resources to get an idea of application performance. We even cover a similar topic on a recent blog: Top 5 Kubernetes Load Testing Tools
Open Source
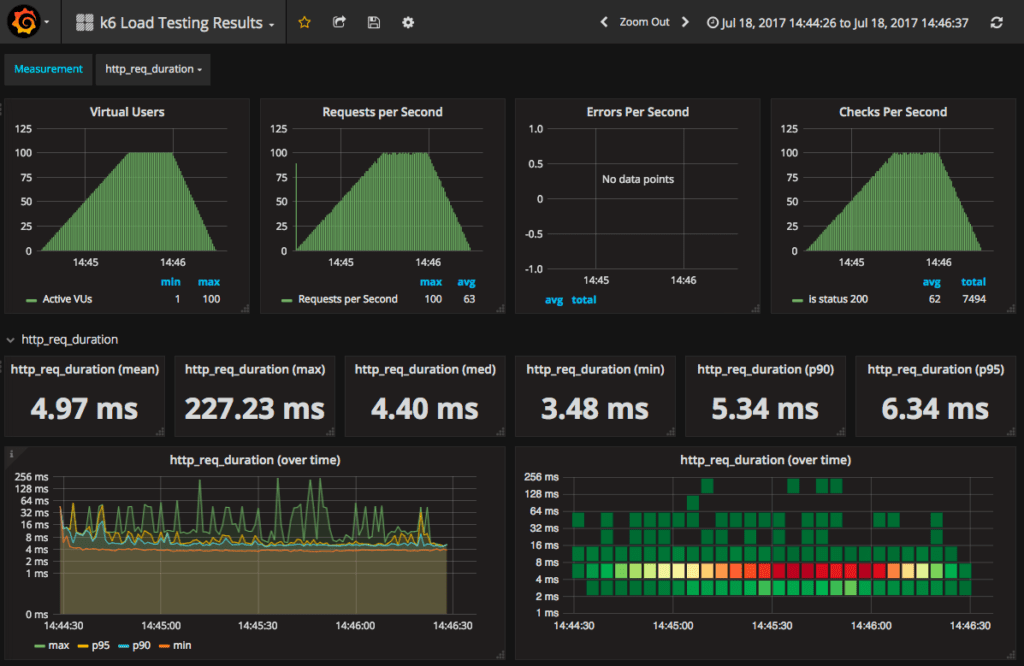
These two groups were already working together, going as far back as four years ago, if not earlier. In the Grafana open source dashboard repository you can find some examples for how to graph k6 metrics in a standard way.

While both of the organizations are open source, interestingly Grafana changed their license to AGPL in April 2021. K6 has been using AGPL since 2016. One of the interesting trends in open source is how major projects choose to license their code. They want to strike a balance between having an open source offering and community while preserving the ability to build a cloud service. According to the Grafana license FAQ:
We considered SSPL and watched community response to the decisions that MongoDB and Elastic made. We really respect their decisions, but we’ve decided that we want to keep Grafana Labs software under OSI-approved licenses, because the support of the open source community is very important to us.
OSI is Open Source Initiative. They are the ones that judge which licenses are “real” open source and which ones are not. The SSPL was created by MongoDB to try to stop cloud vendors from offering a service on their tech. OSI later determined that SSPL it is not a “real” open source license because its wording does not let you do whatever you want with it. However, Grafana Labs has stuck with AGPL which does have the OSI seal of approval. It will be interesting to see if there are changes to their open source roadmaps as the acquisition completes.
Observability + Load Testing
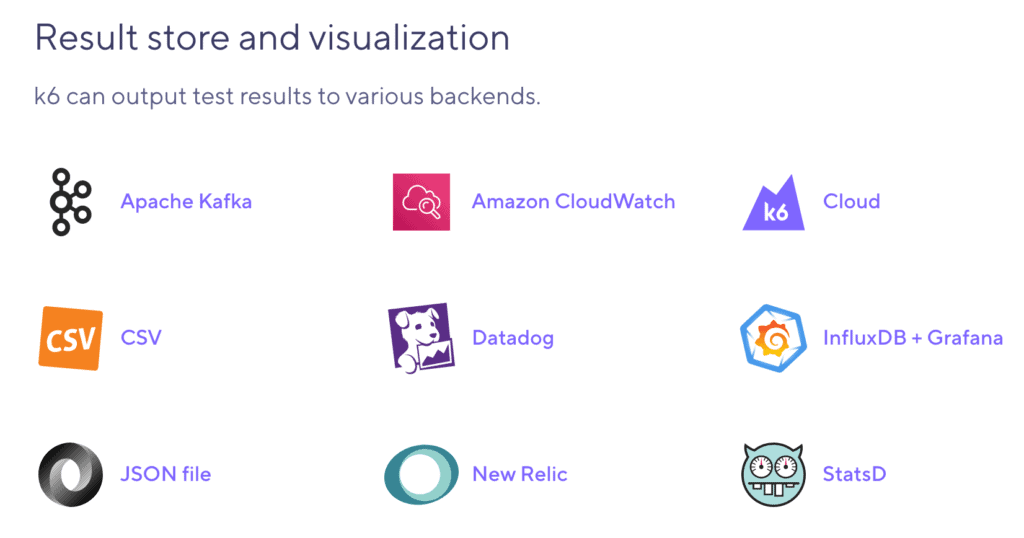
The last big value point of this combination is connecting Observability and Load Testing data together. Grafana focused traditionally on production with their Observability suite. Users frequently deploy k6 for load testing in non-production environments. It makes sense to put all this telemetry in the same place. The lines are blurring between a traditional QA / Testing function and an Operations / Monitoring function. When you are doing releases continuously, understanding the expected performance of the code that is about to get pushed will be paramount. And this kind of integration is hardly new because k6 already had a ton of other Result Store Integrations as well:

It will be interesting to see how k6 handles this over time. Will they continue to integrate with everyone or will they favor Grafana integrations primarily?
Additional Perspectives
While I was reading up about this announcement, I was intrigued by an article by Bruce Gain in The New Stack. But instead of simply reiterating the news, he did his own research and even connected with an analyst from EMA. There are definitely synergies with the combination of load testing and observability. But there are potential integration challenges coming as well. Here is an observation from Torsten Volk of EMA:
…creating a setup for even semi-realistic load testing often is a pain and adds to the overall development cost. If Grafana and K6 can offer turnkey dashboards and load generators that developers can turn on and off at the flick of a switch, then this would be a very attractive offering.
Indeed there are many difficult challenges in building and running performance suites:
- Tests – Building the test cause automation itself is technically challenging and laborious, even though k6 is simple to use the authors need to create lots of scripts.
- Environment – Having something that mirrors the target system (ex: production, integrated with third parties) can be incredibly challenging to build.
- Data – You must configure and reset the underlying data between test runs.
The Grafana and k6 integration looks poised to make it as easy as possible to analyze data from subsequent runs, but teams will still need to figure out how to solve this Triple Threat (read more in the article from Nate Lee).
Speedscale helps developers release with confidence by automatically generating integration tests and environments. This is done by collecting API calls to understand the environment an application encounters in production and replaying the calls in non-prod. If you would like more information, drop us a note at hello@speedscale.com .