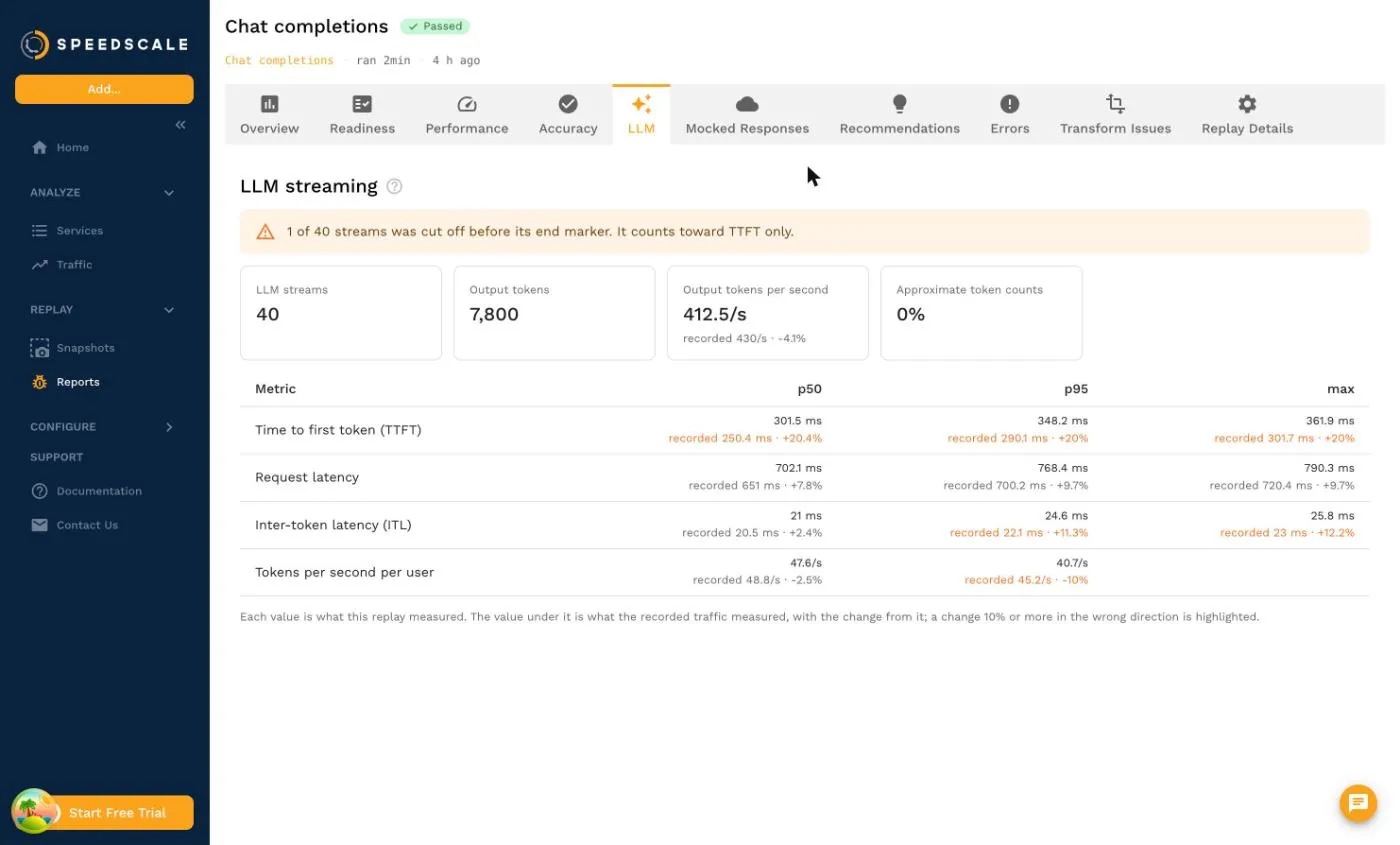
Speedscale replays now measure the numbers teams use to judge LLM serving: time to first token (TTFT), inter-token latency (ITL), request latency and output tokens per second. The definitions match NVIDIA AIPerf, the benchmarking tool in NVIDIA’s NIM guides. The prompts come from your own recorded traffic, and the report shows what production measured under every replayed value.
- A Speedscale TTFT, ITL or tokens-per-second number uses AIPerf’s formulas, measured on the requests your users really sent.
- Recordings made with
proxymock recordor the Kubernetes sidecar carry production’s own frame timing, so each replay is compared with production and a change of 10% or more is highlighted. - Every LLM metric can fail a replay, with
--fail-iflocally and as a test-config goal in the cloud.
Request latency hides the wait users feel
A streamed answer runs on two clocks. TTFT is the wait before anything appears, which NVIDIA’s NIM guide describes as “how long you wait before seeing the model’s output”. ITL is the pace of the text after that.
Request latency adds the two together. Databricks’ 2023 inference engineering guide writes it as TTFT plus the time per output token multiplied by the number of tokens. Two servers with the same request latency can feel very different: one shows text at once and streams slowly, while the other stays blank and then delivers the whole answer.
Pace has a ceiling. The 2024 Andes study puts reading speed at 4.8 tokens per second and finds that streaming faster than a user consumes text does not improve their experience. The wait before the first token has no such ceiling, because the user sees nothing until it ends.
Benchmarks run on sonnets
AIPerf is the successor to GenAI-Perf and defines the vocabulary most teams use for these numbers. Its synthetic prompts average 550 input tokens by default, and its default prompt corpus is Shakespeare’s sonnets.
NVIDIA’s NIM benchmarking quickstart sweeps concurrency through 1, 2, 5, 10, 50, 100 and 250 with fixed input and output lengths per use case: 200 and 200 tokens for translation, 200 and 5 for classification, 1,000 and 200 for summarization. The input length standard deviation is set to zero.
That design fits its purpose. Fixed lengths isolate the hardware, so a run on one GPU class compares cleanly with a run on another. It cannot tell you how your own prompt mix behaves, because your prompt mix is not in the run.
NVIDIA’s parameters guide makes the same point: “If you have production traffic, you can use real prompts as inputs.” AIPerf can replay trace files, and its launch post lists trace replay from production traffic among its features. The hard part is producing the trace.
Real prompt mixes are lopsided
The public traces that exist show why fixed lengths mislead. Microsoft’s Splitwise paper (2024) studied two Azure inference services. The coding service had a median prompt of 1,500 tokens and a median output of 13 tokens, while the conversation service had a median prompt of 1,020 tokens and a median output of 129. Neither resembles 200 in and 200 out.
Input length drives TTFT. The NIM parameters guide states that “Longer input sequences increase prefill memory requirements and TTFT.” A synthetic run with no spread in input length has no long prompts, so its p95 TTFT says little about the p95 of a mix that contains them.
Workload research reaches the same conclusion from the serving side. The authors of BurstGPT collected 10.31 million traces from Azure OpenAI services over 213 days and note that serving systems “are frequently evaluated under unrealistic workload assumptions.” Alibaba’s ServeGen (NSDI 2026) reports that modeling real workload characteristics “avoids 50% under-provisioning compared to naive workload generation.”
Real requests also carry more than a prompt. System prompts, tool definitions, conversation history and generation settings all change what the server does, and a recording keeps every one of them.
Same definitions, your traffic
A Speedscale replay sends recorded requests to a model server, or to a service in front of one, and times every frame of each streamed response. The formulas follow AIPerf’s metrics reference: ITL is request latency minus TTFT, divided by output tokens minus one, and the per-user token rate is 1 / ITL.
Speedscale recognizes four response formats from the stream itself:
- OpenAI-compatible: OpenAI, Azure OpenAI, NVIDIA NIM, vLLM, TGI and Ollama’s OpenAI-compatible endpoint.
- Anthropic Messages:
/v1/messageswithstream: true. - Ollama native:
/api/chatand/api/generate. - Amazon Bedrock:
ConverseStreamfor any model, andInvokeModelWithResponseStreamfor Anthropic models.
Token counts come from the server’s own usage report when the stream has one. When it does not, each output frame counts as one token and the report states what share of streams were estimated, so you know how far to trust the token rates.
Every metric can gate a run. proxymock replay --fail-if 'llm.ttft-p95 > 800' exits 1 in a terminal or in CI, and the same metrics are goals in a test config for cloud replays. The companion how-to walks through both.
The recording is the baseline
A synthetic benchmark produces a number. A replay of a timed recording produces a comparison. proxymock record and the Speedscale Kubernetes sidecar store the arrival time of each frame of a streamed response, so a recording of production LLM traffic carries production’s own TTFT and ITL.
Replay that recording against a new model, GPU class, quantized checkpoint or gateway build, and the report’s LLM tab shows each replayed value with the recorded value and the change under it. A change of 10% or more in the wrong direction is highlighted, such as a slower TTFT or a lower token rate.
The screenshot uses demo fixture data. On a real recording of a test server that waits 300 ms before its first token, proxymock record measured a TTFT p50 of 301.52 ms and the replay measured 301.7 ms.
Streams that end early are kept out of request latency, ITL and the token rates, because a cut-off stream would make the server look faster than it was. They still count toward TTFT and have their own counter, so a goal can fail on them.
What it does not do yet
- Mocked LLMs answer at once. When a replay mocks the model a service calls, the mock sends the recorded stream in one write. Measure a model server by replaying traffic against the real server.
- Metrics cover the whole run. There are no per-stage values and no concurrency sweep table. To compare concurrency levels, run one replay per level.
- Some captures have no timing. Traffic captured by the eBPF-based nettap capture, imported from a HAR file or generated from a spec has frames but not their arrival times, so its replays show replayed values only.
AIPerf remains the right tool for hardware sweeps and for replaying traces on an absolute arrival schedule. To run it on your own prompts, proxymock export aiperf converts a recording into a mooncake_trace file that AIPerf loads directly, with credential headers removed. Mask sensitive request bodies with your DLP rules before you export.
AIPerf tells you what the hardware does with a sonnet. A replay of your recording tells you what your users will get after the change, measured against what they got before it. The LLM streaming metrics guide lists every metric and goal name.
Use an LLM for a scoped task
Use this prompt to apply the comparison to one of your own model endpoints.
Scoped LLM prompt
Read https://speedscale.com/blog/your-users-dont-send-sonnets/ and https://docs.speedscale.com/guides/replay/llm-streaming-metrics/, then inspect my project instructions. Find where my service sends or serves streamed LLM requests and which of the four supported formats it uses. Propose how to record that traffic with frame timing using proxymock record, which LLM metrics should fail a replay and at what thresholds, and whether my streams include a usage report or will be counted approximately. Check installed proxymock help before adapting commands. Do not record or replay anything until I approve the plan, then report the checks actually run and their results.Frequently asked questions
What are time to first token and inter-token latency?
Time to first token (TTFT) is the time from sending a request to receiving the first frame of output. Inter-token latency (ITL) is the decode time after that first token divided by the remaining tokens. Speedscale uses the same formulas as NVIDIA AIPerf, so its numbers mean the same thing as AIPerf numbers with the same name.
How is this different from running AIPerf?
The metric definitions are the same. NVIDIA's documented NIM workflow drives AIPerf with synthetic prompts of fixed length. A Speedscale replay sends your recorded requests, and when the recording has frame timing the report shows what production measured next to each replayed value. To run AIPerf on your own prompts, proxymock export aiperf converts a recording into a trace file AIPerf can load.
Can I measure an LLM that my service calls through a mock?
No. A mocked LLM sends the recorded stream in one write, so it has no streaming timing to measure. Measure a model server by replaying traffic against the real server.