We’ve gotten used to understanding our applications through signals, summaries, and traces. Tiny little bits of information about how the app really works. Not because that’s the best way to do it, but because it’s been too hard to get the real thing.
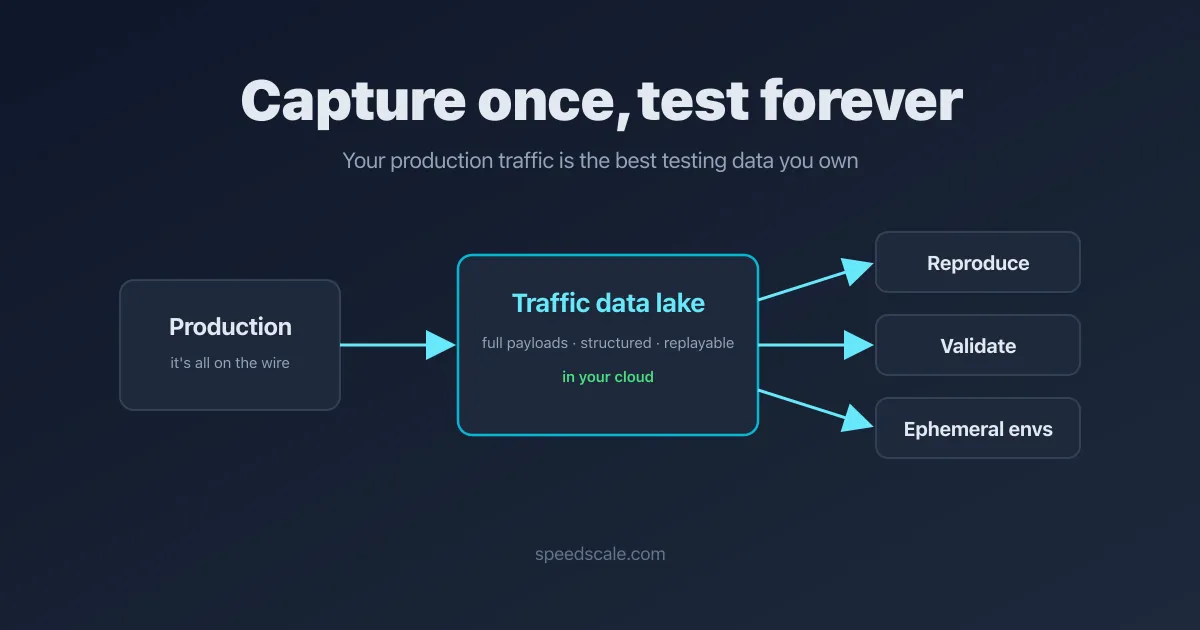
The real information exists. It’s on the network. How people called your app and what your code did. What other systems it called, the database queries it made, and the result sets that came back. The NoSQL store that got hit, how long it took to respond, and what data it returned. All of it is sitting right there on the wire.
It’s just been too difficult to gather. So we sample it, summarize it, count it, aggregate it. And the summaries are great for knowing that something broke. The problem is when it comes time to actually solve it, the aggregates have lost the overall story. That’s “The Observability Gap”: detection works, and everything after the alert is still manual.

Why we settle for summaries
Sampling and aggregating wasn’t a design choice, it was physics. In the early 2000s the computers weren’t as good. We didn’t have much storage, and what we had was expensive. Capturing the real data at scale was impossible, so the industry built tools that summarized instead.
And we’ve papered over the difference with super smart engineers. They read through all these signals and try to reconstruct what happened, while ultra stressed, because they’re getting alerts and pages in the middle of the troubleshooting they’re already doing. At one company I worked at, we had a Slack channel called the Emergency Room. That’s where you went during an incident. Then another incident would happen at the same time, so we made Emergency Room 2. It’s borderline ridiculous how hard it is to get visibility into what’s actually going on.
Storage changed the math
None of that physics holds anymore. Storage costs have plummeted, and it’s now incredibly cheap to keep this data around in a structured format. That’s the key thing we’ve learned. The same data, if you’re smart about it, structure it, and keep it around, tells you how the application is really working. A couple of use cases fall out of it immediately.

Reproduce the problem that’s actually happening
When a problem is happening in production, the first thing you want is to replicate it. The ability to reproduce a problem that’s really happening in production is a majority of the way to solving it. You have the visibility into the data, you have access to the application, you run those exact transactions into your code.
And here’s the other key finding: most of this code depends on other systems being there. So simulate those too. Your app calls a downstream system, a database, a third-party API. When you have the traffic and it’s structured, those can be mocked out from the recorded responses. Now you can reproduce problems that are really happening in production, on your laptop or in CI, without the production blast radius.
This isn’t theoretical. We benchmarked it: an AI agent, handed captured production traffic instead of just the alert, went from a 51% fix rate to 77% and stopped editing the wrong service.
Validate the fix before you ship it
You’ve reproduced the issue. You have a hypothesis. You’ve written new code. How long until you find out whether it actually works?
How many times have you waited two weeks to get that code released to production? Okay, you’re fast, you release in two days. You’re really fast, you release in two hours. Any gap at all means you’re waiting for feedback, and by the time it arrives you’ve moved on and forgotten about the fix. And a lot of the time it breaks anyway. Even the best AI coding agents are breaking about half the time they put new code in.
Replaying the captured traffic against your fix answers the question before the release, not after. Same requests, same dependencies, pass or fail. Cimpress runs their load validation this way and cut testing time by 80%.
Ephemeral environments, not eternal staging
The only way to validate like this is an environment that replicates production conditions, and the trick is that it doesn’t need to live long. A few minutes. Maybe an hour. A day if you’re making a big change. Forget the staging environment you keep running for six months, or some special build that exists forever. This thing lives just long enough to troubleshoot what’s really happening, and then it’s gone.
Keep it in your own cloud
This requires a new approach to observability: deep inspection of traffic. And traffic is sensitive data. You don’t want to ship it across the internet to a third party, then review their SOC 2 and their ISO certs to convince yourself they handle it correctly. Trust me, I know. We have a SOC 2 compliance program and it’s a pain in the neck for everyone involved.
So keep it in your own cluster. Your own cloud infrastructure, sitting right next to your production code. Your data never becomes someone else’s promise not to train on it.
Build it or buy it
If you believe this is a different way to solve production issues, you have two choices. Figure out how to build it (what do I need to vibe code? can I hand this to the latest agent? the latest model just came out, maybe it can build this for us). It’s a complicated problem, and the capture pipeline is the easy part. Or get it off the shelf.
This is what we’ve built at Speedscale. It’s a traffic-oriented system. It taps into eBPF on the nodes where your infrastructure runs and gets access to the data. eBPF has been in Linux for years, but it hasn’t been used for this until now. It works for all protocols and technologies, including encrypted traffic, because everything important is encrypted. You keep it in your own cloud, store it in your own bucket, send it to whatever observability tool you prefer.
The most important part: when you’re having an incident, you tap into the traffic, reproduce the problem, validate the fix, and prove it all out in an ephemeral environment that’s only there long enough to see it.
Where this comes from: I’ve worked in monitoring and observability for over 20 years, going back to Wily in the early 2000s where we did some of the first Java monitoring. I’ve spent my whole career watching this industry summarize data because it had no other choice. That’s how I know the choice exists now.