Load testing is one of the most common ways to test the resiliency of your web application. In this k6 tutorial, we reveal how recording production data with Speedscale and exporting to k6 gives you maximum benefits. Implementing performance tests with both tools allows you to:
- simulate traffic spikes
- verify the resiliency of both applications and the infrastructure as a whole
- implement production data simulation
Speedscale + k6 tutorial overview
When it comes to load testing, two of the most modern tools are Speedscale and k6. While there are many reasons for choosing one over the other, there are more benefits to using them together. If you want to know what the main differences are, check out this in-depth comparison.
By default, Speedscale integrates directly into your Kubernetes cluster with their Operator. k6 is an open source load testing tool that is more commonly used on its own, run on your local PC.
In many organizations there are several good reasons for integrating a load testing tool directly into your infrastructure, such as the ability to integrate with your CI/CD pipelines, plus, a Kubernetes Operator isn’t much more work to manage.
On the other hand, there may be times when you don’t require a fully integrated system, and you want to load tests directly from your PC instead. This is where k6 comes into play, and we’ll explain why, exactly, this is useful for your test case later.
First, let’s break down why you’d want to implement load testing for your test case in the first place.
What is load testing?
Load testing is a type of performance test that determines how well an application performs when subjected to an anticipated number of users. While load testing is done most commonly via HTTP requests, more advanced tools like Speedscale and k6 will also work with other protocols like gRPC.
This might make load testing seem simple, but there are many ways to maximize the benefits. For example, Speedscale allows for production data simulation – this means you can record real production traffic, which you can then replay for load tests.
Depending on the test case, proper load testing should also consider other scenarios such as: mocking the backend, transforming authentication headers, etc.
Why combine k6 and Speedscale?
With k6 load tests, you can run test execution on a local PC (whatever your test case may be, like k6 load testing, performance testing, stress testing, smoke testing, browser testing), whereas Speedscale is more focussed on integrating with your entire infrastructure.
In practical terms, this means Speedscale can be used as part of a development workflow, but it also means your development applications have to run in a Kubernetes cluster. If you’re using other tools like Skaffold, this is not an issue. Many organizations, however, still have developers run applications directly on their local hardware, and in those cases you still want the ability to perform load tests.
So, why use k6 with Speedscale?
Well, k6 cannot record production data, so you will have to create the tests yourself. This can be useful if you have specific scenarios that you want to replicate, but it’s not ideal when you want to ensure that your overall application responds properly to real-life traffic.
By recording production data with Speedscale and exporting it to k6 load tests, you can run a load test from your own PC using real-life production traffic – the best of both worlds.
Exporting Speedscale snapshots to k6 load tests
This tutorial will guide you through creating a load test with Speedscale, and then exporting it to a k6 test.
Objectives
- Deploy a demo application to Minikube
- Instrument application with Speedscale
- Create a load test
- Export and run it with k6
Set up Minikube
- Install Docker
You can either choose to install Docker Desktop, or you can install Docker via the following script:
curl -fsSL https://get.docker.com -o get-docker.sh && sh get-docker.sh- Add user to the Docker group
Usually docker needs to be run as sudo, but there is a way to circumvent this, which will make following this tutorial a lot easier. The following command will add your user to the docker group, allowing you to run it without sudo.
sudo usermod -aG docker $USER && newgrp docker- Download and install Minikube
Installing Minikube can be done in a few different ways, depending on what operating system you’re using. If you’re on MacOS or Linux and have Homebrew installed, you can run:$ brew install minikube
- Start Minikube
minikube start- Verify Minikube installation by viewing all pods:
kubectl get pods --all-namespacesDeploy a demo application
- Clone the demo repo and go to the nginx example
git clone https://github.com/speedscale/demo.git && cd demo/nginx- Deploy the demo application
kubectl apply -k ./- Verify the deployment
Open a connection to the gateway service
kubectl port-forward svc/gateway 8080:80 --namespace=demoOpen a new terminal window, and try to call the nginx gateway endpoint:
curl localhost:8080/payment/Your output should resemble the following:
{ "status": "ok", "service": "payment", "version": "1.0" }Close the terminal window and close the connection by pressing CTRL+C
Set up Speedscale
NOTE: These instructions can also be found at the top of the Speedscale UI dashboard, which is also where you’ll find your API key.
- Sign up for a free trial of Speedscale
- Install the Speedscale Operator
Add the Helm repo
helm repo add speedscale https://speedscale.github.io/operator-helm/ && helm repo updateInstall the Operator (be sure to replace the API key)
helm install speedscale-operator speedscale/speedscale-operator -n speedscale --create-namespace --set apiKey=<api-key> --set clusterName=demo-cluster- Install the speedctl CLI
sh -c "$(curl -Lfs https://downloads.speedscale.com/speedctl/install)"If you are running on Linux without a display, you may run into an error after inputting your API key. If so, simply ignore the error and continue with the next step
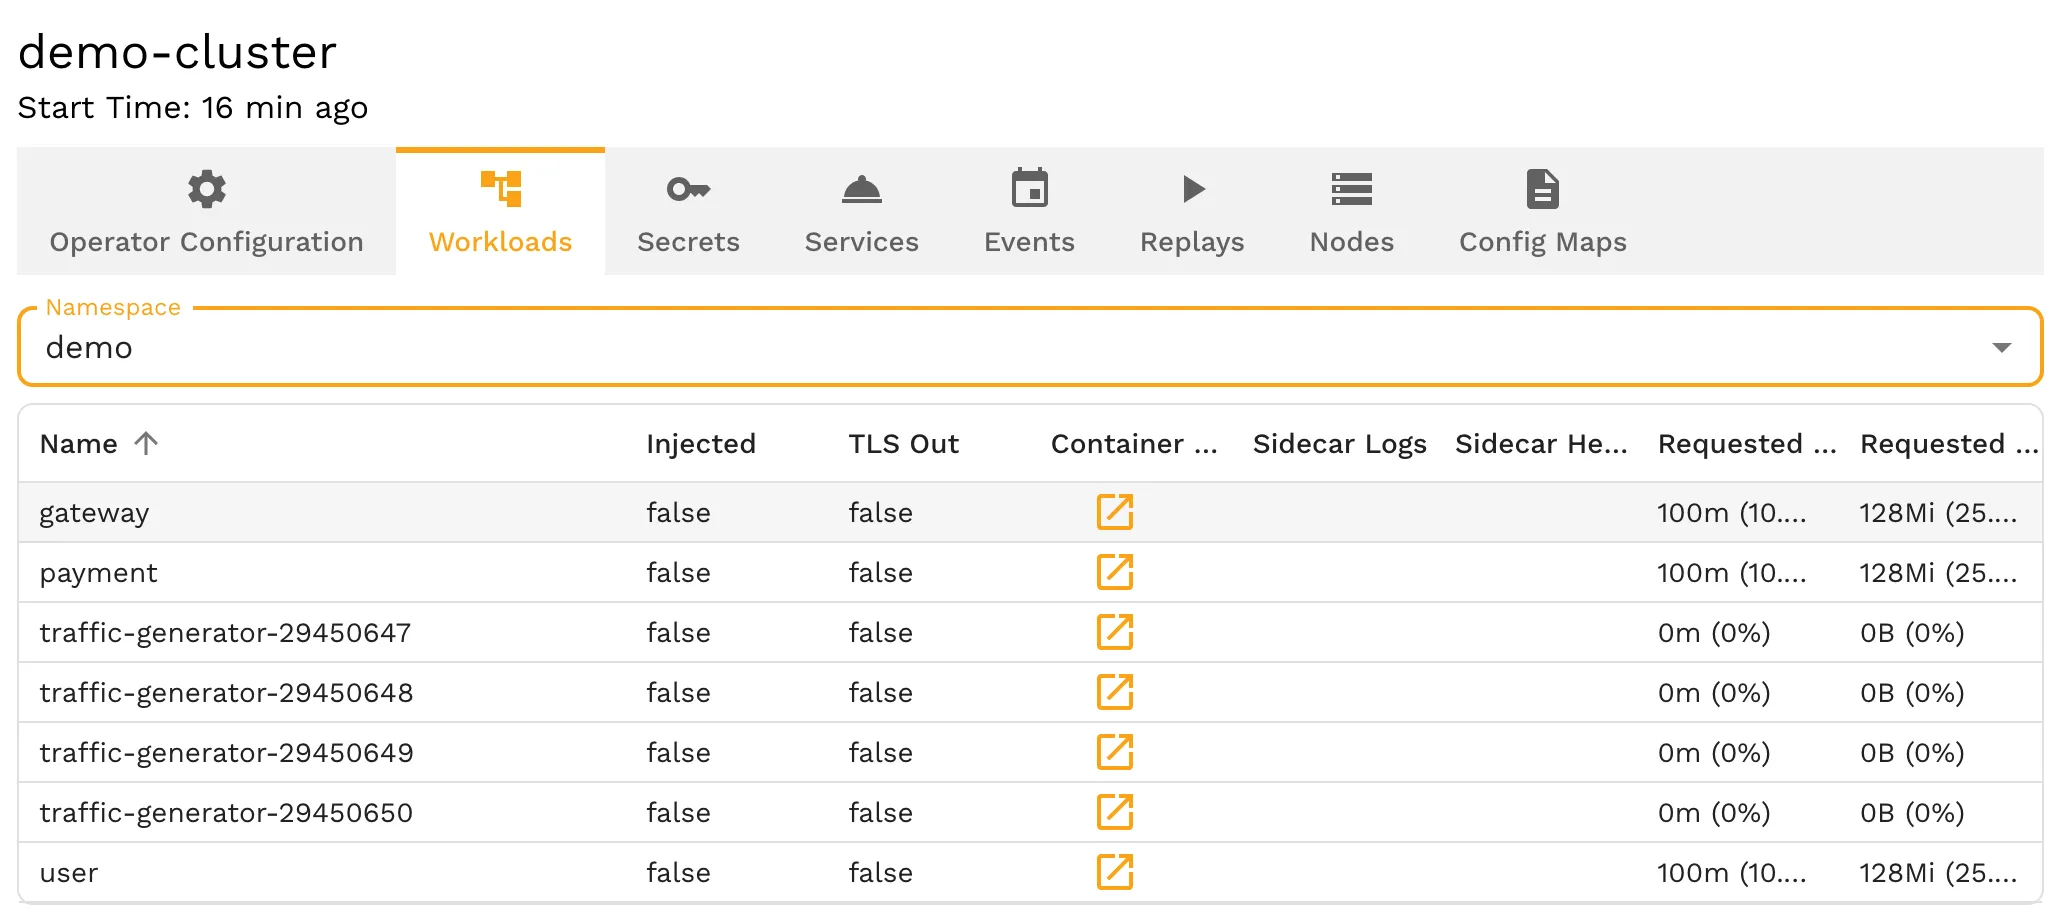
- View your cluster in Speedscale
Go to the Speedscale dashboard and navigate to the Infrastructure screen. You should see your cluster in the list. Click on your cluster named demo-cluster then navigate to the workload list and select the demo namespace where you installed the demo app.
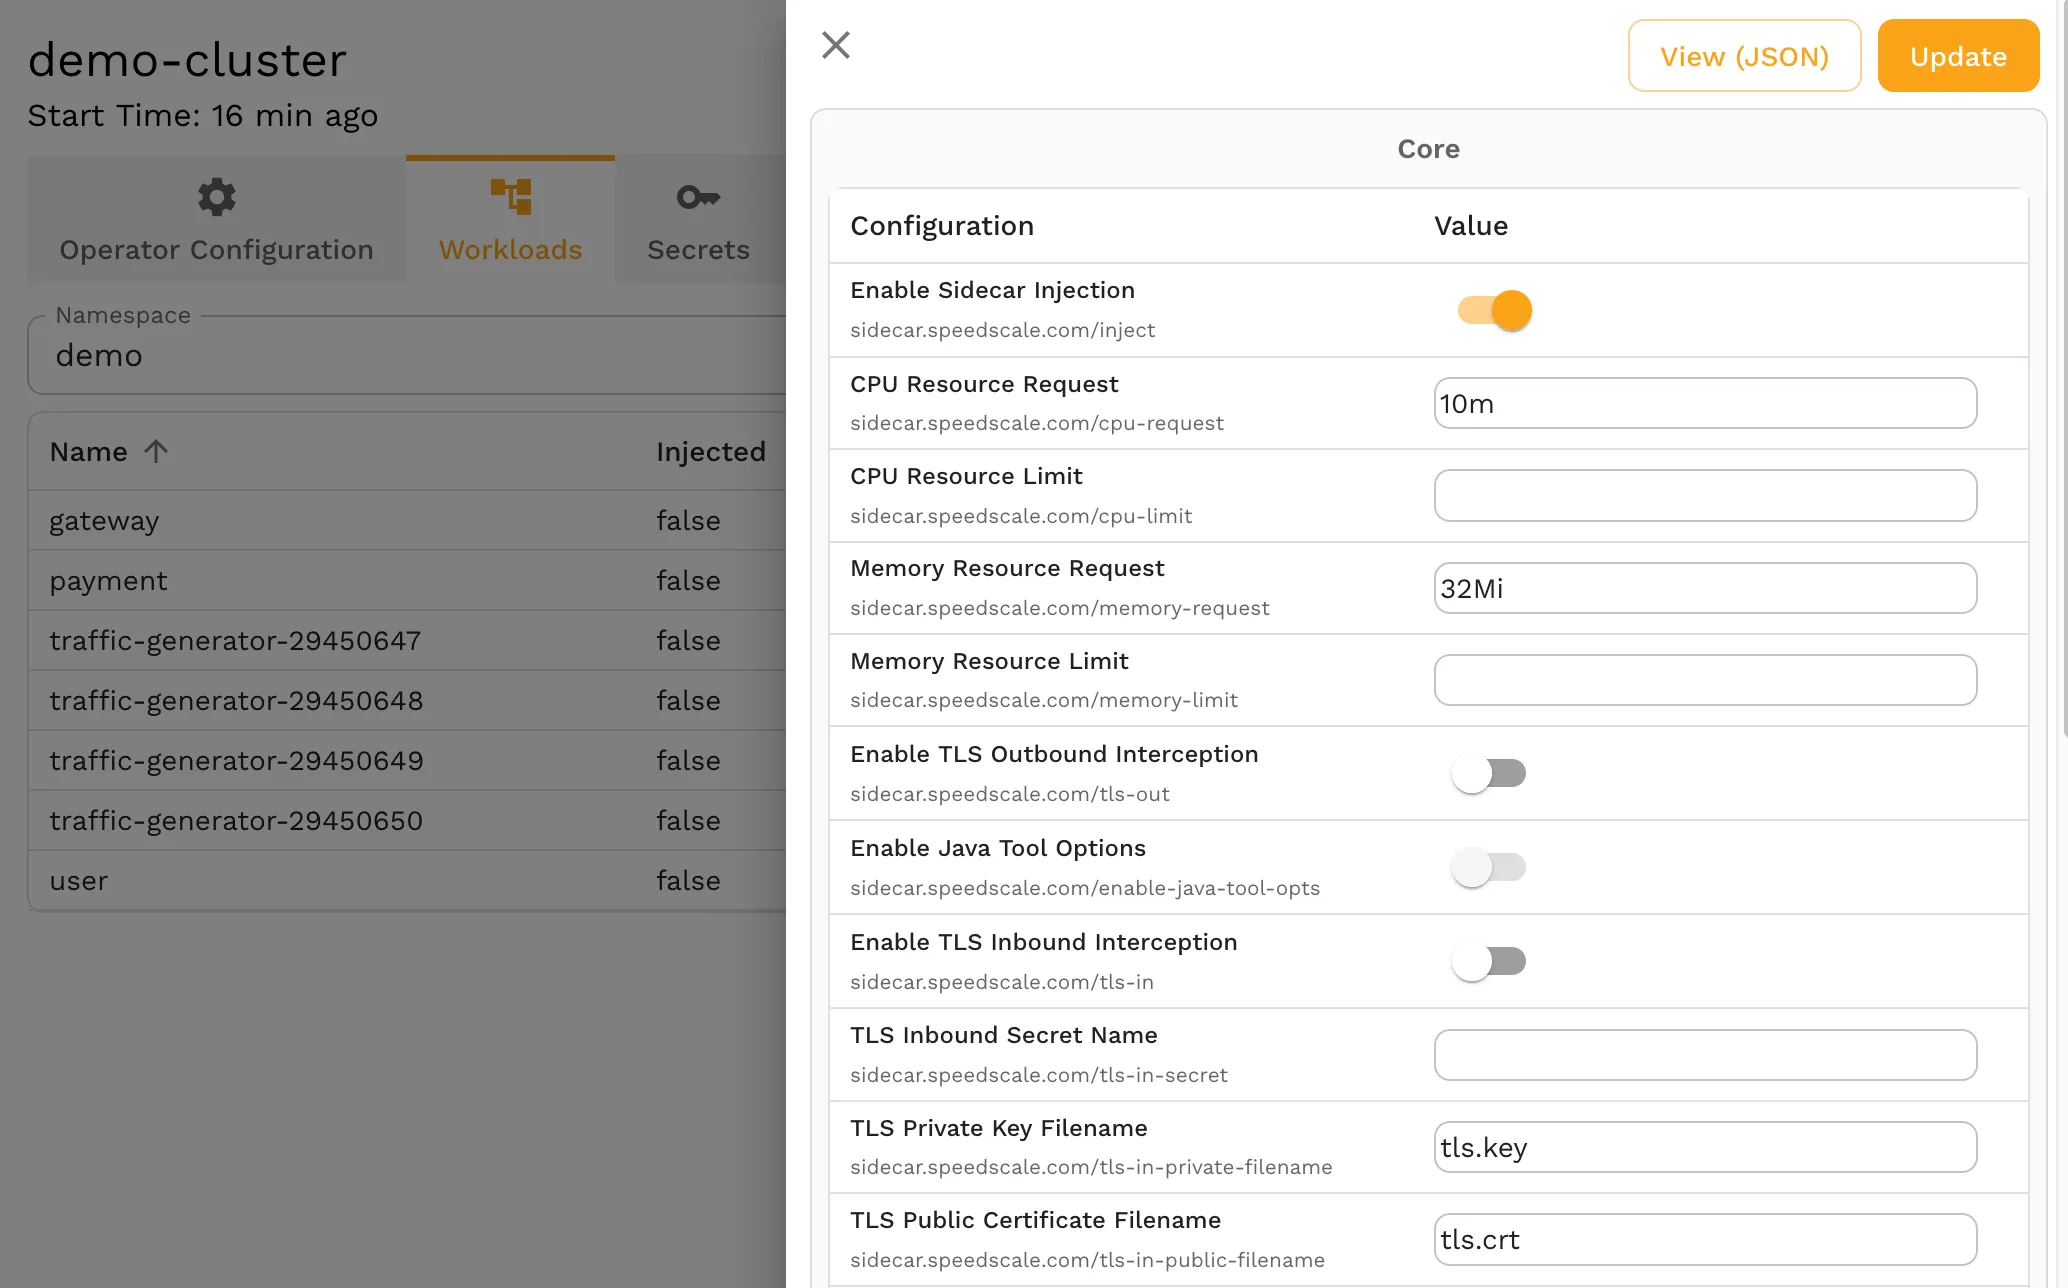
- Instrument the services with Speedscale
If you click on one of the workloads (like payment), then you can inject the sidecar.
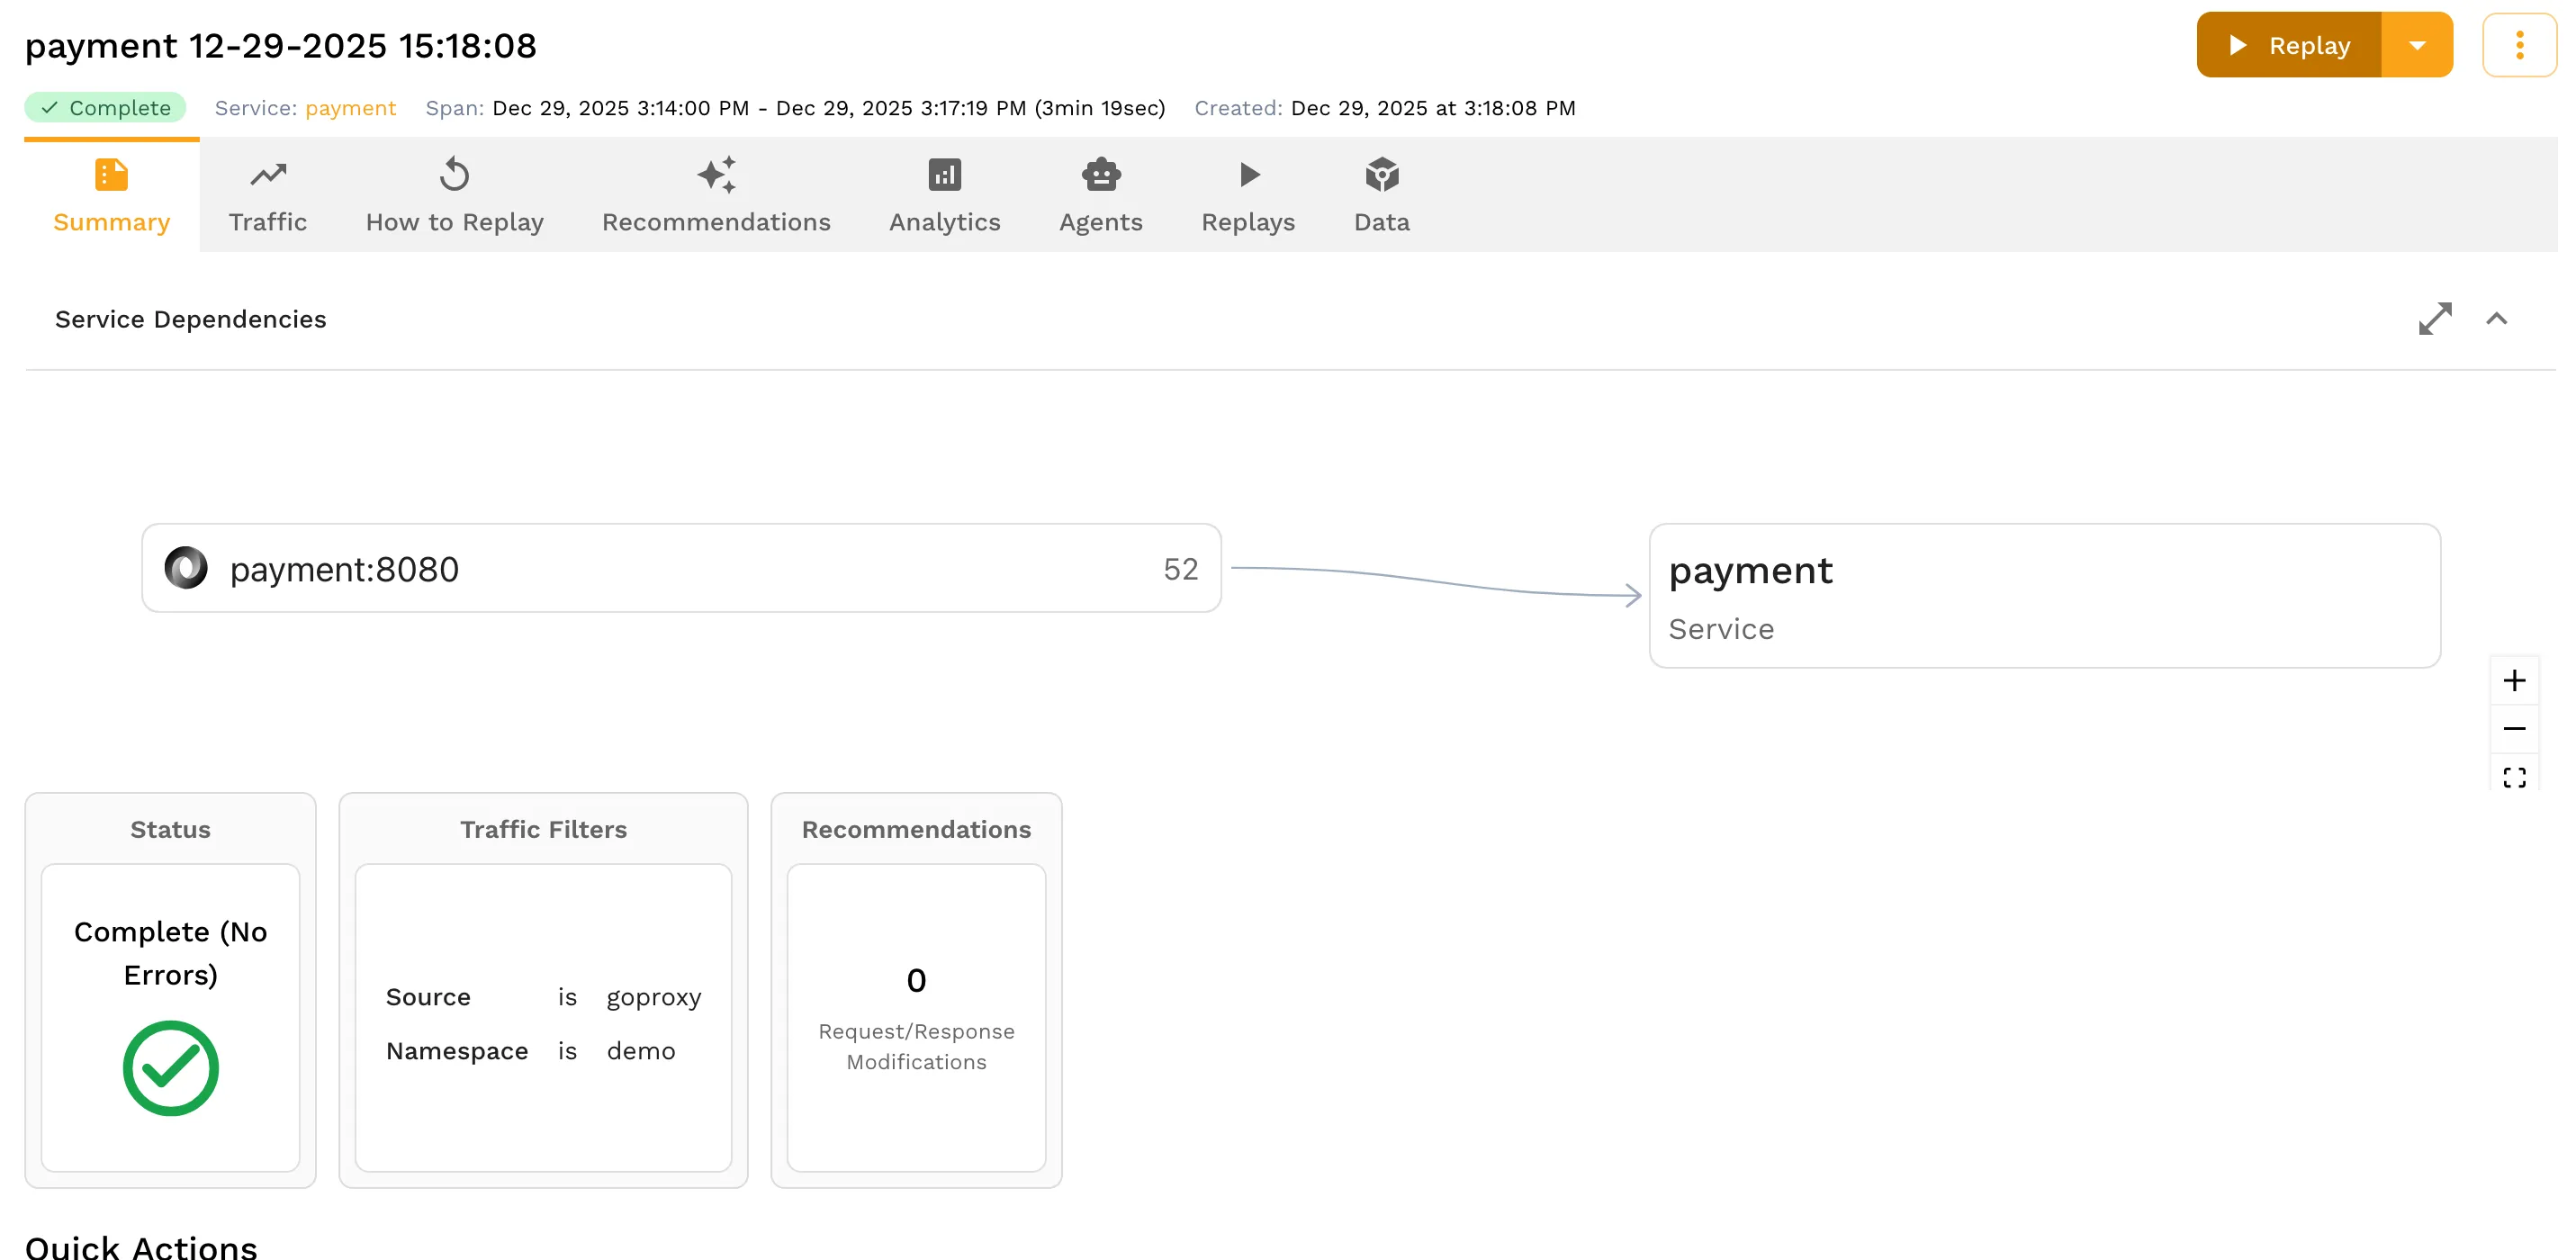
- View captured traffic
After a few minutes you should see some traffic appear in the Traffic Viewer.
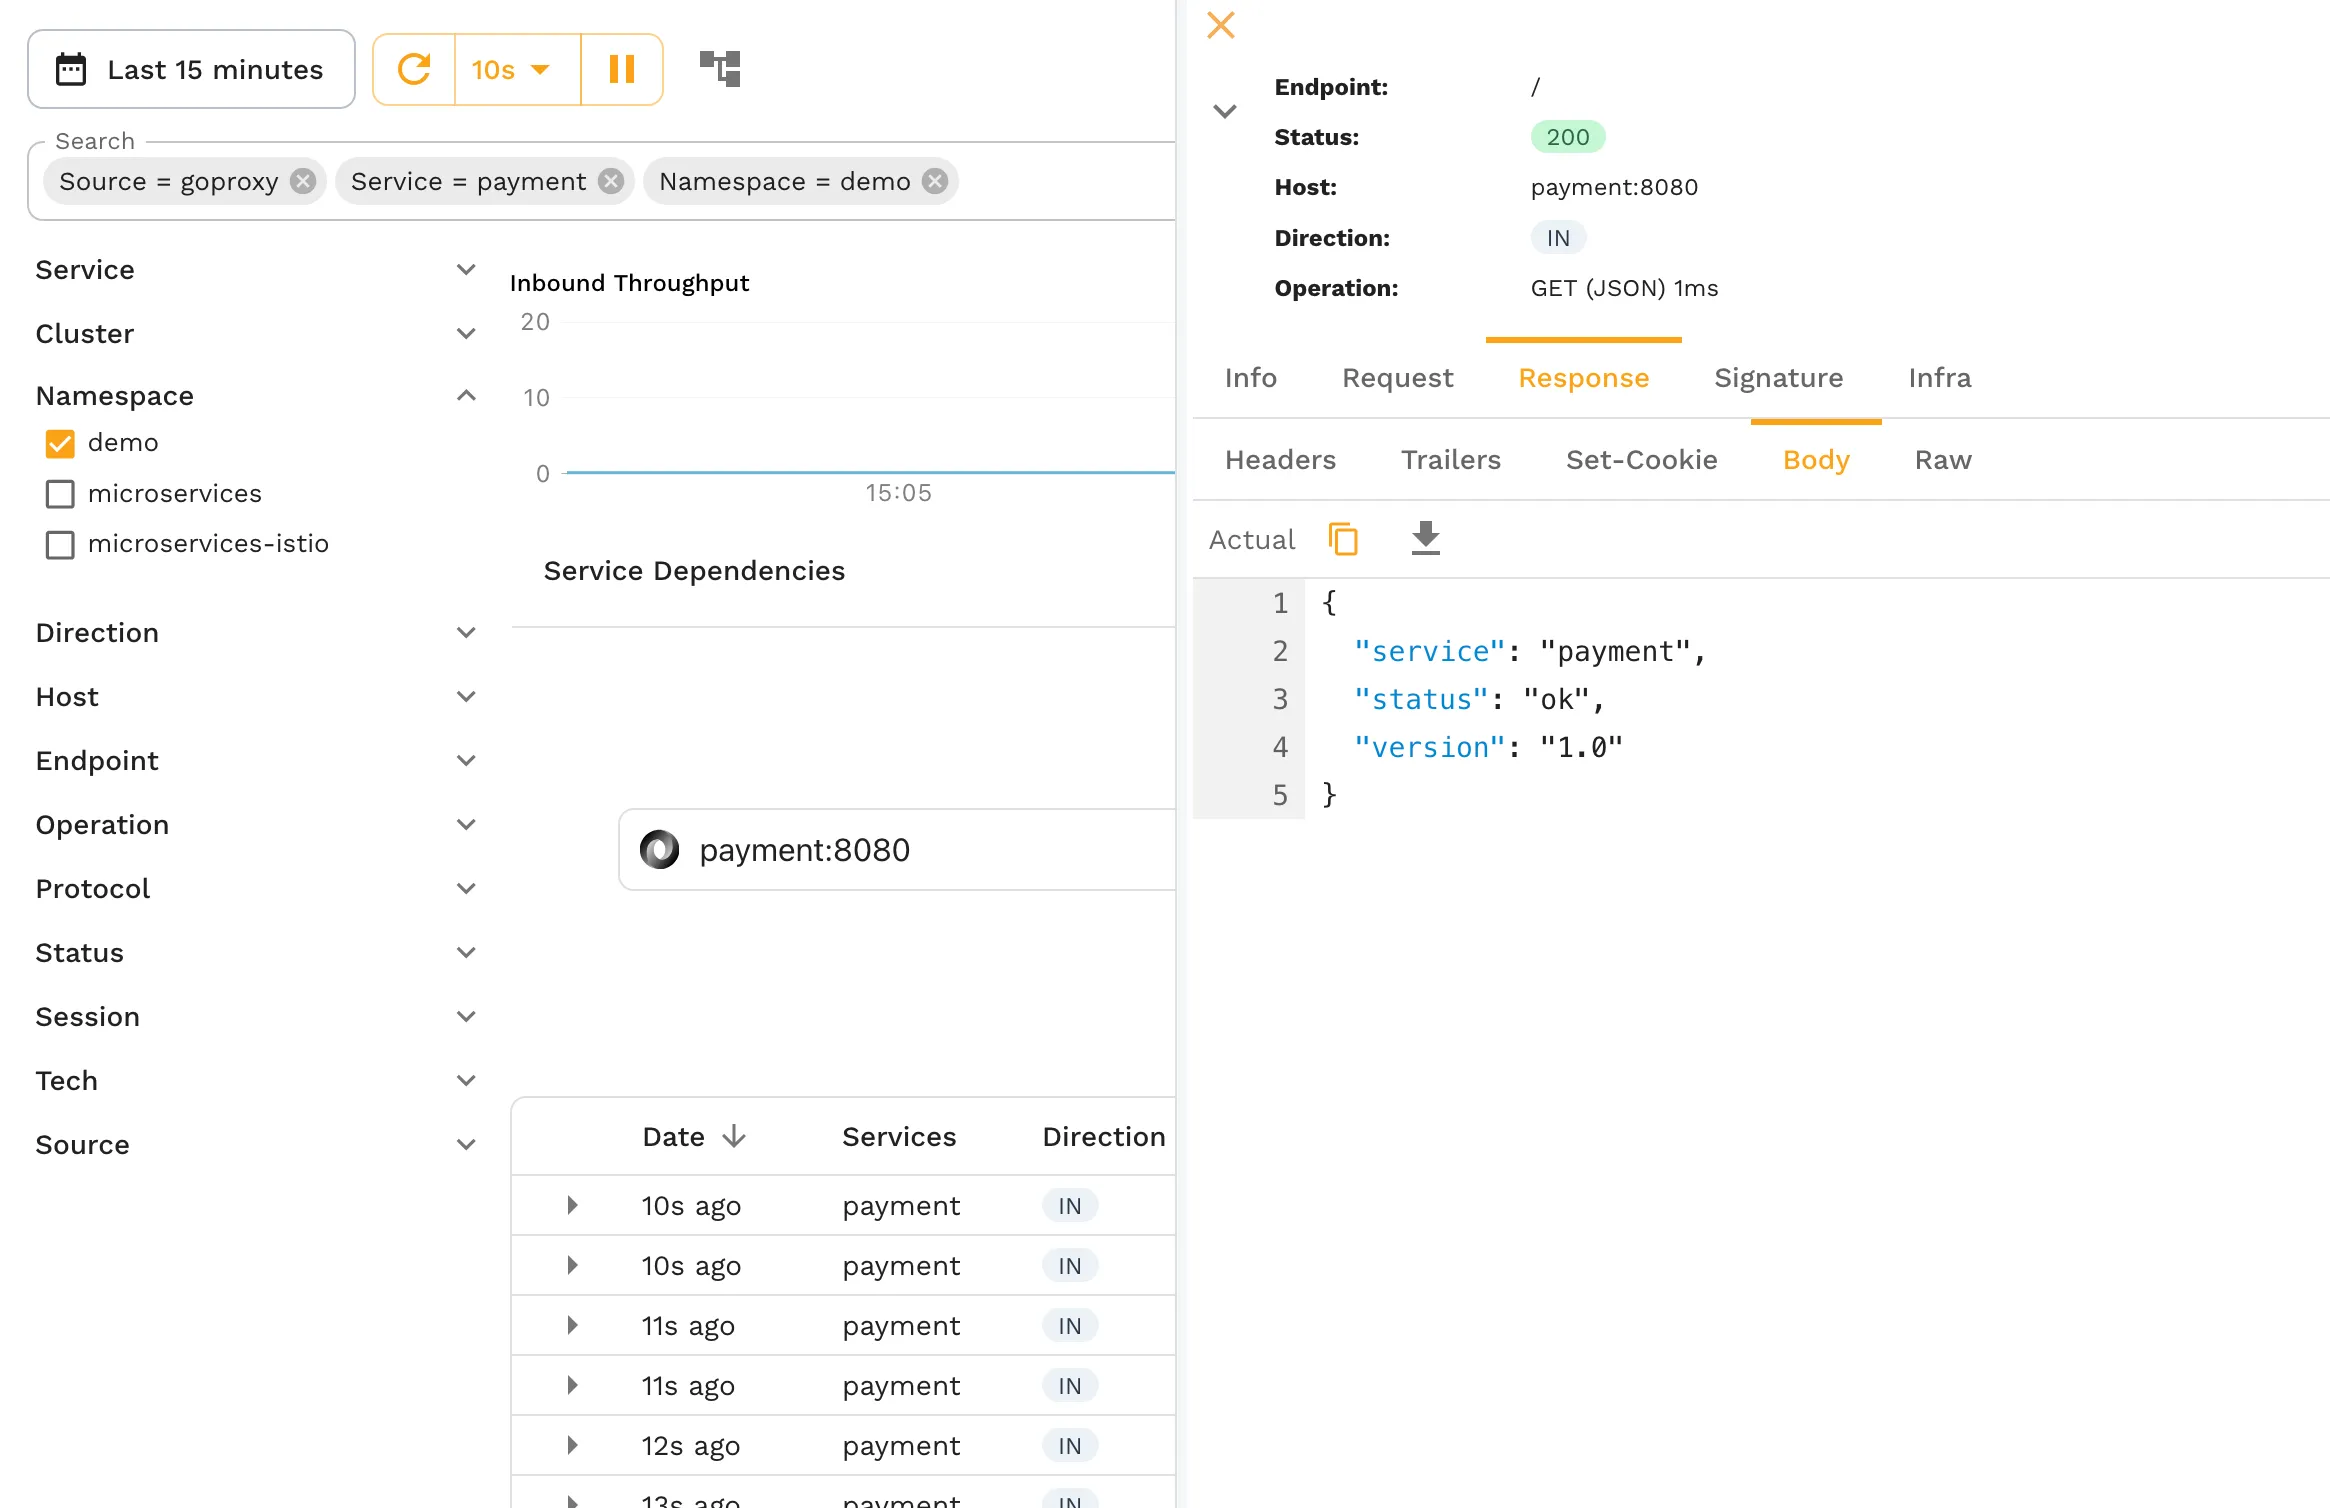
- Save this traffic into a snapshot
From this page, click the SAVE button in the upper-right corner, you will see a snapshot is created. This snapshot has the traffic that has been captured and can be re-used as a k6 test.
Set up k6
Before you export your performance test script from Speedscale, you need to install the k6 tool to run test execution. If you’re running Debian/Ubuntu, run the commands below to install k6. If you’re on another operating system k6’s website has official installation instructions for your OS’s package manager.
If you’re using Docker, there is an official docker image for the k6 tool as well. The official docker image can help streamline your Docker deployments.
Note that the k6 CLI runs your k6 script, not Node.js, despite k6 tests being written in JavaScript or TypeScript.
Export and run a load test to k6
- Note the snapshot ID by viewing the “How to Replay” tab:
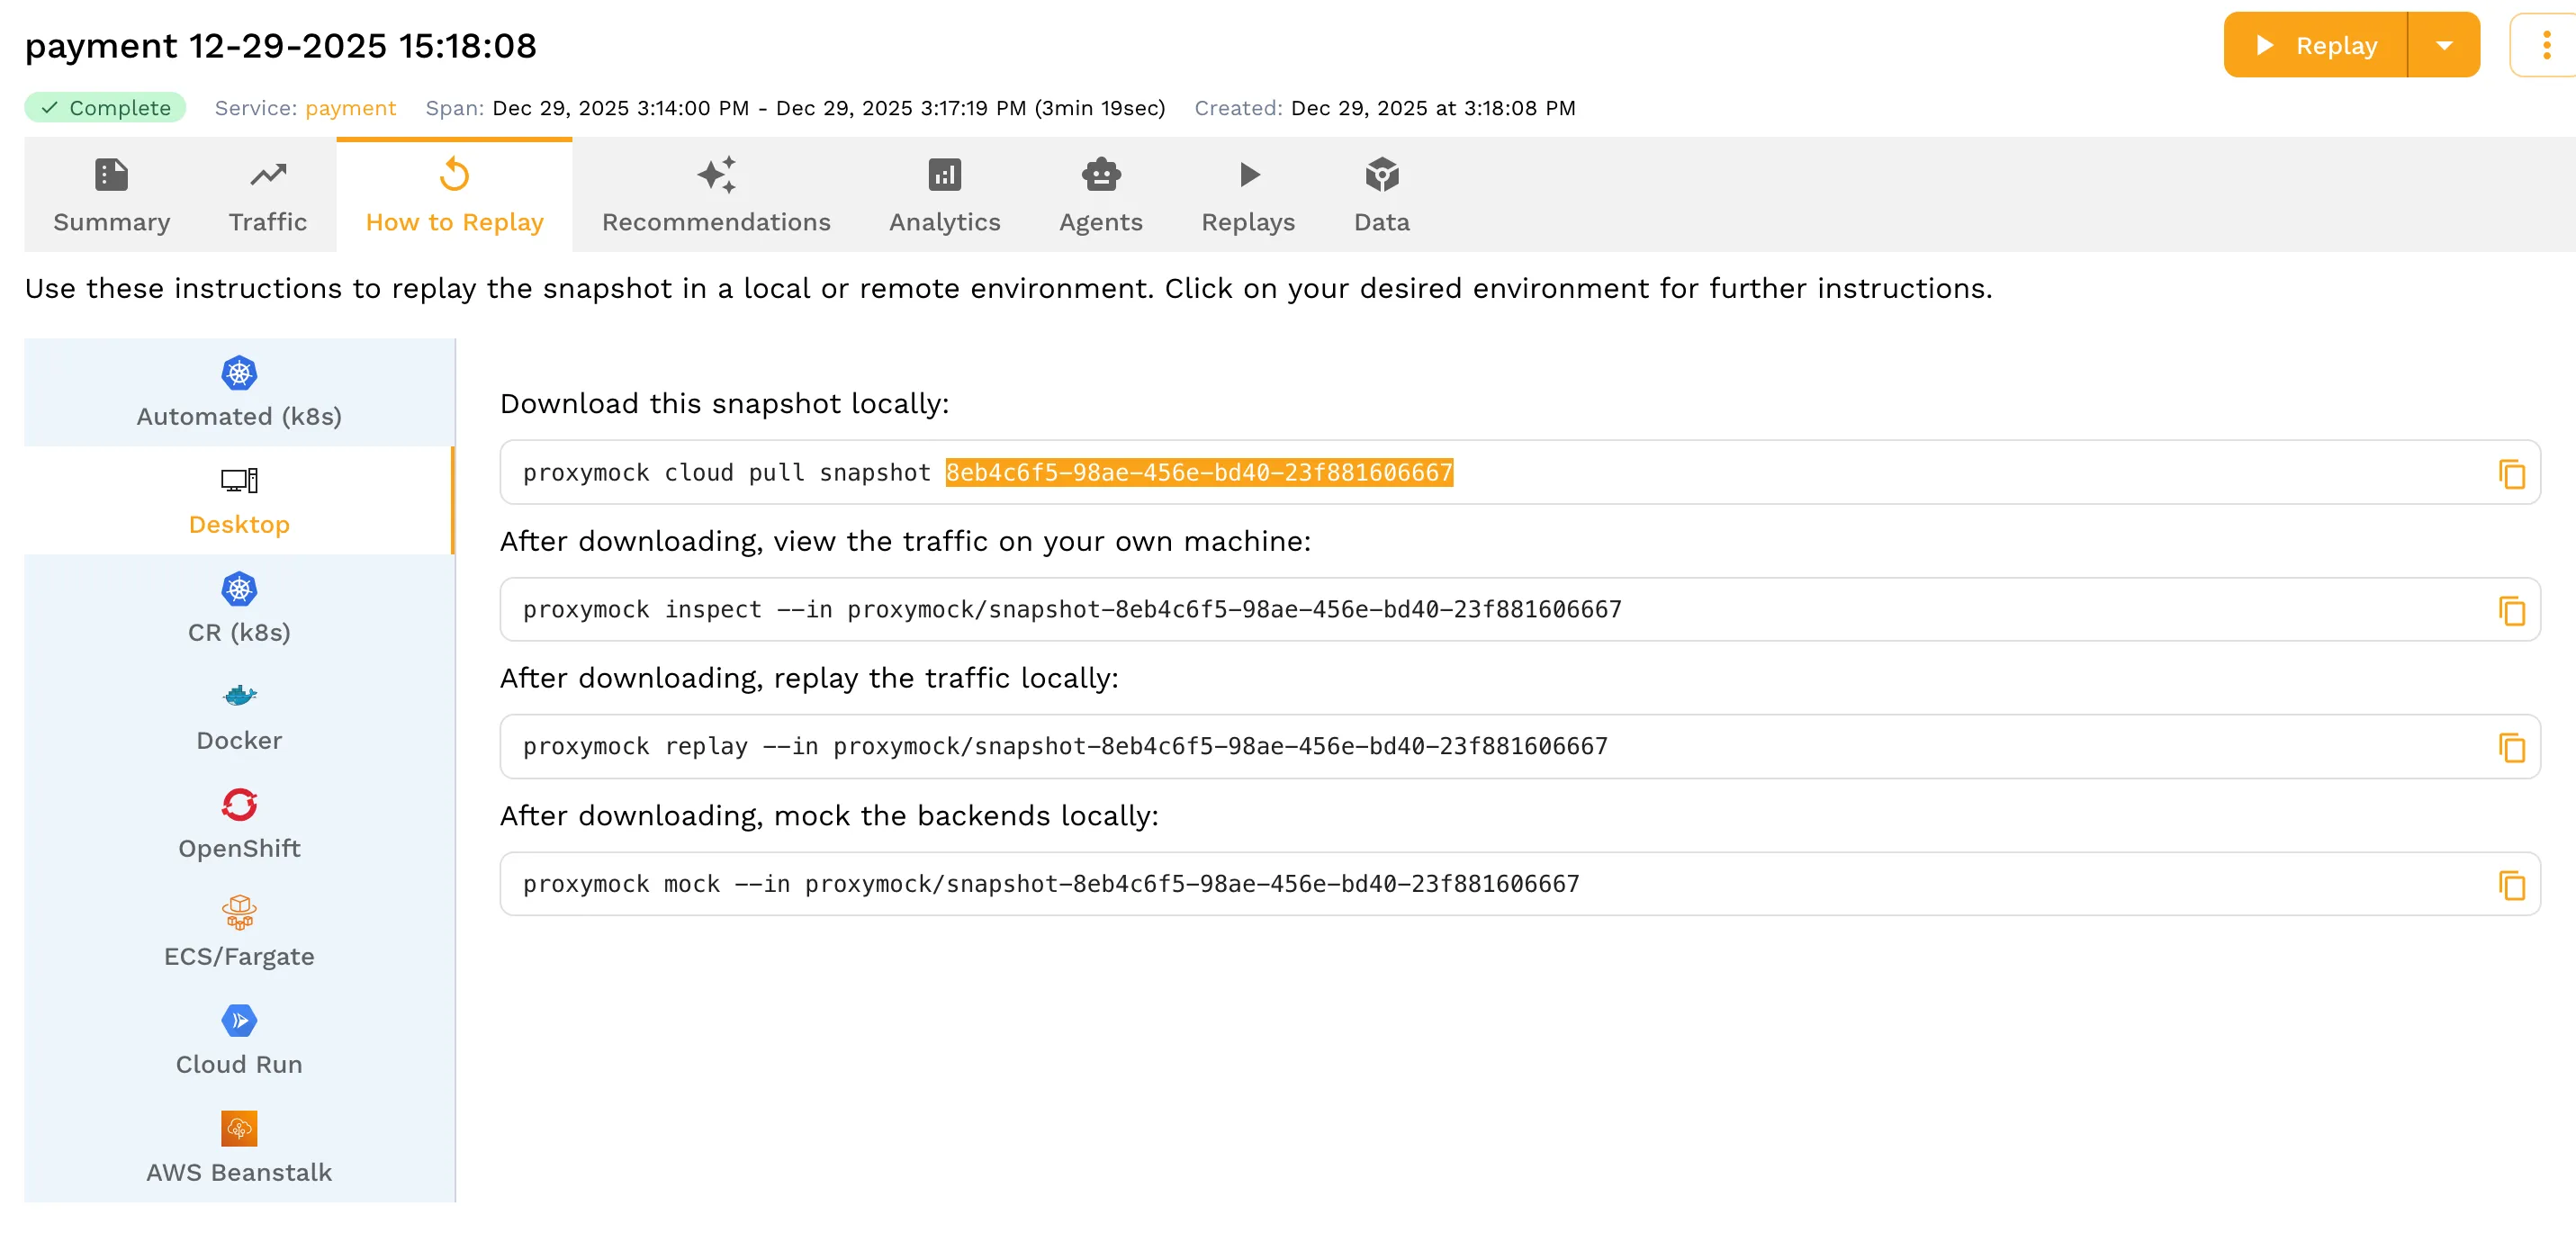
- Use the snapshot ID to export the load test to a k6 file:
speedctl export snapshot <snapshot-id> --type k6The output should look like this and show you a file named k6.js was created:
                         _               _
 ___ _ __   ___  ___  __| |___  ___ __ _| | ___
/ __| '_ \ / _ \/ _ \/ _` / __|/ __/ _` | |/ _ \
\__ \ |_) |  __/  __/ (_| \__ \ (_| (_| | |  __/
|___/ .__/ \___|\___|\__,_|___/\___\__,_|_|\___|
    |_|

Exporting snapshot 8eb4c6f5-98ae-456e-bd40-23f881606667 to format k6
Snapshot exported successfully to k6.js
Your k6.js file should have an http.request for every route in the virtual user code
import http from "k6/http";
import { URL } from 'https://jslib.k6.io/url/1.0.0/index.js';

export default function () {
{
  let params = {
    headers: { 'Host':'payment', 'User-Agent':'curl/8.17.0', 'Accept':'*/*', 'Connection':'close' },
  };
  let method = 'GET';
  let body = '';
  let url = new URL('http://payment/providers');
  http.request(method, url.toString(), body, params);
  }{
///- Set up a tunnel to the payment service
We want to run the tunnel so that port 8080 on our local machine will forward to the payment service in the Kubernetes cluster.
kubectl port-forward svc/payment 8080:80 --namespace=demo- Update the hostname
Change the k6 test file to use the tunnel instead of the Pod’s hostname
sed -i '' 's/payment/localhost:8080/g' k6.js- Run the k6 test
Finally you can run the script like this:
k6 run k6.jsThe output should show you how it ran:
         /\      Grafana   /‾‾/
    /\  /  \     |\  __   /  /
   /  \/    \    | |/ /  /   ‾‾\
  /          \   |   (  |  (‾)  |
 / __________ \  |_|\_\  \_____/

     execution: local
        script: k6.js
        output: -

     scenarios: (100.00%) 1 scenario, 1 max VUs, 10m30s max duration (incl. graceful stop):
              * default: 1 iterations for each of 1 VUs (maxDuration: 10m0s, gracefulStop: 30s)


  █ TOTAL RESULTS

    HTTP
    http_req_duration..............: avg=17.67ms  min=3.14ms   med=4.29ms   max=106.79ms p(90)=84.58ms  p(95)=91.75ms
      { expected_response:true }...: avg=17.67ms  min=3.14ms   med=4.29ms   max=106.79ms p(90)=84.58ms  p(95)=91.75ms
    http_req_failed................: 0.00%  0 out of 52
    http_reqs......................: 52     55.174814/s

    EXECUTION
    iteration_duration.............: avg=942.35ms min=942.35ms med=942.35ms max=942.35ms p(90)=942.35ms p(95)=942.35ms
    iterations.....................: 1      1.061054/s

    NETWORK
    data_received..................: 37 kB  39 kB/s
    data_sent......................: 5.3 kB 5.6 kB/s


running (00m00.9s), 0/1 VUs, 1 complete and 0 interrupted iterations
default ✓ [======================================] 1 VUs  00m00.9s/10m0s  1/1 iters, 1 per VU
Optional: Run on k6 Cloud
k6 Cloud is k6’s premium commercial SaaS offering for managing k6 tests and optimizing performance engineering. To deploy a k6 test script to k6 Cloud, start by signing up for an account on the k6 Cloud platform. Once registered, you can upload your exported k6 test script and configure things like the total number of virtual users and VU code. k6 Cloud provides real-time insights and performance metrics like response times, making it easier to identify bottlenecks and optimize your performance engineering.