An engineering leader asked me a question a few weeks ago: could we read their business workflows out of API traffic instead of asking people to document them?
I said it should be possible. Then I tried it.
A few engineers know how the system really works. They know which calls make up a work order and which checks happen after a write. That stuff rarely makes it into the test plan. Usually it’s in somebody’s head. Sometimes it’s in several heads, with slightly different answers.
API traffic is a pretty good witness. It shows what people and machines actually did, in order, with the payloads attached.
So I wrote a traffic classifier. It’s a few hundred lines of Python. I pointed it at an hour of captured traffic from our demo banking app and tried to recover the workflows from the calls. I expected grouping calls to be the hard part. The harder problem was deciding which differences mattered.
What I built
The first problem was identity. I used the subject in a JWT when I had one. Before login, I fell back to the username or email in the request. That connected the anonymous start of a signup or login to the authenticated calls that followed.
Sessions came next. Inside a session, I used a write as the anchor for a unit of work and attached the reads that followed it. For read-only activity, I split on pauses. A screen fires a burst of calls, then a person sits there for a while. In this sample the boundary was pretty obvious.
I grouped units with the same write and roughly the same surrounding reads. I also walked the JSON bodies and classified fields from their names and value formats: account numbers, tokens, email addresses, money, and so on.
For names I used a local model. It saw endpoint sequences and field names, but no field values. I care about that detail. Sending captured financial payloads to a model would make the whole experiment much less useful.
The first result
The run had 7,943 calls across 14 endpoints. The classifier resolved 544 identities, split them into 662 sessions, and reported 18 workflow patterns.
That number felt believable. The largest pattern was an account overview and transaction history flow, which appeared 527 times. The other results looked like things a person would actually do: deposit funds, transfer money, register, create an account, export a statement.
For each workflow I got the calls in order, frequency, error rate, and the data classes it touched. Nobody handed the classifier that list. It came out of the capture.
The transfer result was the one I kept coming back to. It split into four variants based on what happened after the transfer. Some sessions re-read the account list. Others went straight to transaction history. Some didn’t verify anything.
If I were writing the test plan, I’d probably have one test called “transfer funds.” The capture gave me four versions, including one where the client never checked whether the transfer worked.
Where I got it wrong
My first attempt matched the exact sequence of endpoints. It reported 114 patterns across 1,339 sessions. That was roughly one new “workflow” for every 12 sessions in an app with a small set of actual user actions.
The classifier had confused request variation with business behavior. An optional balance lookup created a new pattern. A retry created another. The same reads returning in a different order created another. The count kept climbing even though the user was still doing the same thing.
Anchoring on the state-changing call worked much better. I treated the reads around it as a set and ignored the occasional lookup that didn’t appear often enough to define the workflow. The same data dropped from 114 patterns to 22. That was the first result I could use.
The data classifier had an embarrassing bug too. I checked value formats before field names. A 12-digit account number matched my phone-number regex, so I confidently labeled bank accounts as phone numbers. Great.
I reversed the priority. Field names now win when a value is ambiguous. Only formats I can identify with high confidence, such as a valid card number or JWT, override the name.
Free text was another miss. I flagged every string over five words for a closer PII scan. The classifier mostly found Profile retrieved successfully repeated a thousand times. Counting distinct values fixed that. A field containing the same handful of strings across hundreds of calls is probably a status message.
And then I made the worst mistake in the whole experiment. I merged traffic from two clusters.
The report said staging had three badly broken endpoints. I spent time tracing the failures before I noticed every one came from an old build running on my laptop. Both clusters were reporting into the same tenant. The classifier had combined them and I blamed the wrong environment.
Sessions are now keyed by cluster and identity. The report also refuses to combine clusters quietly. That one stung. It’s also why I wanted to build this against captured traffic instead of making a clean sample for the demo.
The comparison I actually want
A workflow report is interesting. I wouldn’t ship a product that stops there.
I want to compare the report with the tests a team already runs. Human-written tests cover what somebody remembered to write down. Captured traffic gives me the list of what actually happened. The difference between those lists is the test gap, and traffic frequency tells me which missing tests matter first.
Caveat I owe you: the unstructured-text detector is written but not proven because this capture had no real prose in it. The field walker only understands JSON, so protobuf payloads are invisible. This sample also came from a synthetic banking workload. Real customer traffic will be messier.
I haven’t solved cross-service workflows either. The hard version of this problem runs through Kafka, Event Hubs, and hundreds of services, where a work-order ID matters more than a user identity. That’s the version I want to try next.
The basic result held up. I could take captured traffic and recover workflows I recognized without asking someone to write them down first.
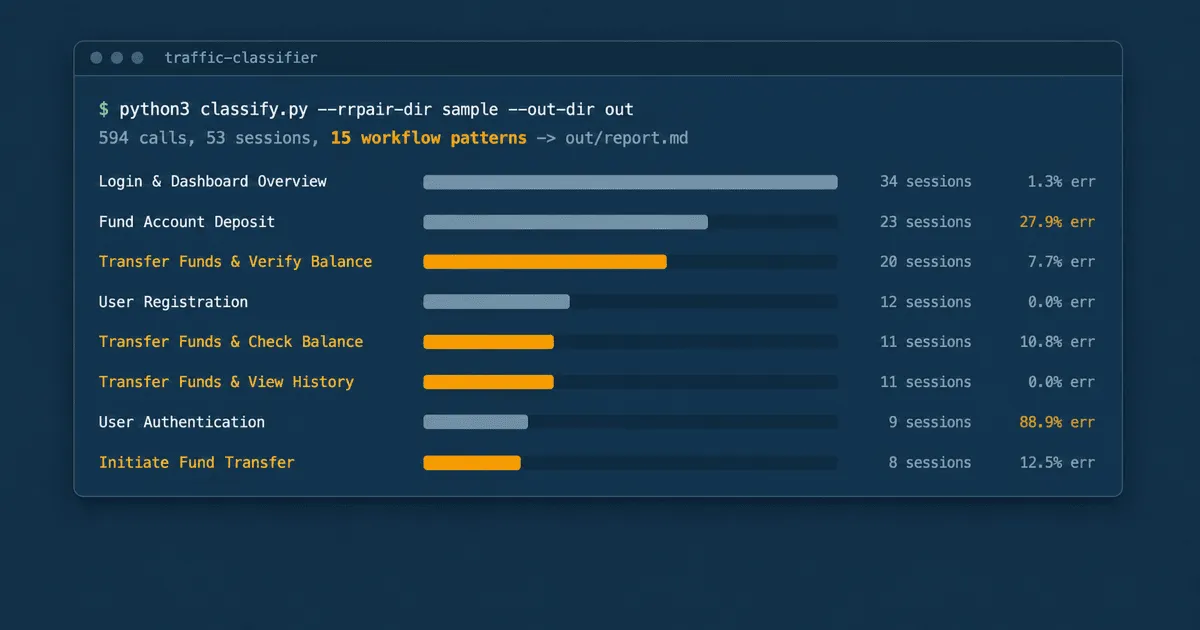
If you want to try the same experiment, the traffic classifier and its five minute sample recording are public. The whole run is one command:
python3 classify.py --rrpair-dir sample --out-dir outThe run prints 594 calls, 53 sessions, 15 workflow patterns -> out/report.md. The chart at the top of this post is that run’s workflow table. Even the sample shows the transfer splitting into variants. It also reports an 88.9% error rate on bare login attempts, which sounds alarming until you open the failing calls and find the load generator trying a password of definitely-not-the-password.
To do this on your own system, record a representative session with proxymock from your app’s directory and keep the payloads attached. Start with one service. My first few reports were wrong in ways I didn’t expect. Yours probably will be too.