In this article, you’ll learn about the best Kubernetes performance monitoring tools that are currently on the market. Although there are a number of application performance monitoring solutions out there, this article covers the best options in terms of their key features, functionalities, ease of setup, and the support garnered from each of their respective communities.
Imagine this: you’ve been trusted with the responsibility of managing your organization’s production Kubernetes clusters. Not only is it important that your Kubernetes clusters remain available, but also, all of the applications hosted on those clusters should remain intact, functional, and readily available. If the platform falls over, the containerized applications will likely fail as well.
This is why it’s so important to understand how your Kubernetes clusters are going to be used and how your applications are deployed on the platform. The question now is, how do you know (with certainty) that the cluster is operational? Is the cluster healthy and ready to host applications? How do you ensure that the cluster has sufficient capacity to support all of its applications? How will you know if one of your hosted containerized applications fails?
As you can see, it’s incredibly important to proactively manage your Kubernetes clusters, which is the point of Kubernetes monitoring. However, monitoring Kubernetes can be difficult. It’s designed as a complex, distributed solution; Kubernetes clusters can (and most likely will) run across multiple Nodes, sometimes in hybrid cloud scenarios. When something goes wrong, it may involve you digging through the logs of several systems and/or services in order to fully investigate your issue(s).
It’s imperative that you integrate a good monitoring stack with your Kubernetes clusters. This allows you to gain the visibility that you need to handle any issues that arise and, in some cases, prevent them from ever happening in the first place.
Kubernetes Monitoring Essentials
While traditional monitoring practices are important no matter the underlying architecture, Kubernetes comes with a unique set of challenges and considerations you’ll have to face. Aligning with these challenges and considerations is crucial in order to achieve a healthy, efficient, and secure cluster.
Below you’ll find an overview of the most essential things to consider when implementing monitoring in Kubernetes environments.
Resource Usage
Throughout these essentials you’ll quickly see a pattern: they resemble traditional monitoring best practices, albeit with slight differences. This is clear when looking at resource monitoring—one of the most basic metrics to monitor.
With a traditional server you’ll have to monitor the CPU and RAM usage, which is still true for Kubernetes Pods. However, in Kubernetes it’s just as important to monitor the resource usage of the underlying infrastructure, i.e., Nodes and clusters. To effectively monitor resource usage in Kubernetes, it’s important to have visibility of the resource usage across the cluster as a whole. One common way to achieve this is to set up dashboards providing visibility into all the parts of your cluster at once. Note this does not equate to having dashboards with every single metric from your Cluster and applications—something that can quickly lead to information overload—but rather, choosing the right metrics to show.
What this looks like will depend on your use case and infrastructure, but some popular metrics to monitor are as follows:
- Cluster Health: Monitoring the different parts of the cluster itself, like the API server and
etcd,can quickly tell you whether anything is wrong. - Node Usage: CPU and RAM usage can tell you a lot about the health of cluster configurations, as you should be setting resource requests and limits to ensure Nodes aren’t being either under- or over-utilized.
- Pods and Containers: An overview showing the number of running, pending, and failed Pods is crucial to gain quick insights into your cluster. You may also want a graph showing the trend of running Pods, letting you quickly spot any sudden spikes in the number of Pods.
- Network: Depending on your application, a quick overview of network metrics like request counts and latency can be vital information to have easily accessible.
- Data Storage: Unmanaged data usage can quickly drive up cost and can happen in a variety of ways, like a sudden spike in logs, or an application not erasing stored data properly.
These are just a few examples of metrics to monitor on a single dashboard, and once again, they are not necessarily specific to Kubernetes. The way you’ll approach this, however, is quite unique.
Instrumenting Applications
Your approach to instrumenting applications for monitoring can have major implications, given the nature of Kubernetes and running many services in a single cluster, with multiple instances of the same service. There are many popular monitoring solutions that work by [log management](https://www.logicmonitor.com/blog/agent-based-versus-agentless->eBPF (extended Berkeley Packet Filter).
Log Management
The challenge of
Rather than having to collect logs inside your application container—or by using a sidecar—you can route logs to stdout, which is then saved in log files inside Kubernetes. Then, you can run a logging agent as a separate Pod, removing any logging logic from your application completely. This approach also has the added benefit of aligning with the popular 12-factor app methodology.
Alert Management
Managing alerts in Kubernetes can quickly become more complex than doing so in traditional architectures. With numerous metrics, many of which have no static threshold like the number of running Pods, staying on top of issues while also avoiding alert fatigue can be a major challenge.
On top of that, failures can sometimes happen in relation to Pods other than the one experiencing the issue. For example, a Pod with a memory leak will drive up RAM usage of the underlying Node as a whole, which can lead to Kubernetes killing random Pods on the Node as a way of lowering RAM usage—even Pods that are functioning normally.
Being alerted about a Pod being killed is of course a useful way of getting notified that something’s wrong, but good Kubernetes alerting includes having that alert provide a context for the surrounding environment as well, so you can much more effectively determine the root cause of the issue.
Cohesive Monitoring
Sometimes a memory leak kills another unrelated Pod, but being aware of other services is crucial in many other aspects of Kubernetes monitoring as well. For example, consider a microservice architecture where an HTTP request passes through five different services. At some point, service number three in that chain fails and triggers an alert.
It’s often not enough to look at logs and metrics of that single service; you also need to know what happened at all previous steps of that request path. This issue is most often solved by implementing tracing—covered in more detail later in this post—which allows you to track a single request through multiple different services.
Even though great tools exist to solve this issue, it’s still another thing you should strongly consider implementing when running multiple services. Although this is true for any microservice architecture, independent of the underlying infrastructure, it’s very common in Kubernetes given the nature of the workloads most organizations are running in their clusters.
Prometheus and Grafana

One of the industry’s favorite Kubernetes open-source monitoring applications is Prometheus. It’s an open-source monitoring tool originally created by the developers at SoundCloud and is mainly written in Go.
Prometheus has a number of features that make it a standout:
- A powerful multidimensional data model to store all of its metrics data;
- Its own functional query language, called PromQL, which enables users to query time series data in real-time;
- A pull model over HTTP to collect time series metrics data;
- Pushgateway, which lets you push time series metrics data to it in cases where data cannot be scraped or pulled.
It’s a great option if collecting time series data is a requirement for your organization, and it’s well suited for monitoring Nodes alongside service-oriented architectures. Prometheus doesn’t require any agents or applications to be installed on your server fleet in order to collect data, and it leverages a component called Alertmanager, which manages alerts and sends notifications via email, on-call systems, and/or group collaboration tools like Slack.
In terms of being extensible, Prometheus has client libraries that will allow you to create custom applications with some of your favorite programming languages. It’s often integrated with Grafana to provide a data visualization layer for observability. It also supports third-party exporters, which in turn enables users to export data from third-party databases (for example) and convert them into Prometheus metrics.
Prometheus can be installed using the precompiled macOS, Linux, and Windows binaries. You can also build and install the components of Prometheus from source, though one of the most commonly used installation options is to run Prometheus on Docker.
For more information about Prometheus, check out their documentation page.
ContainIQ

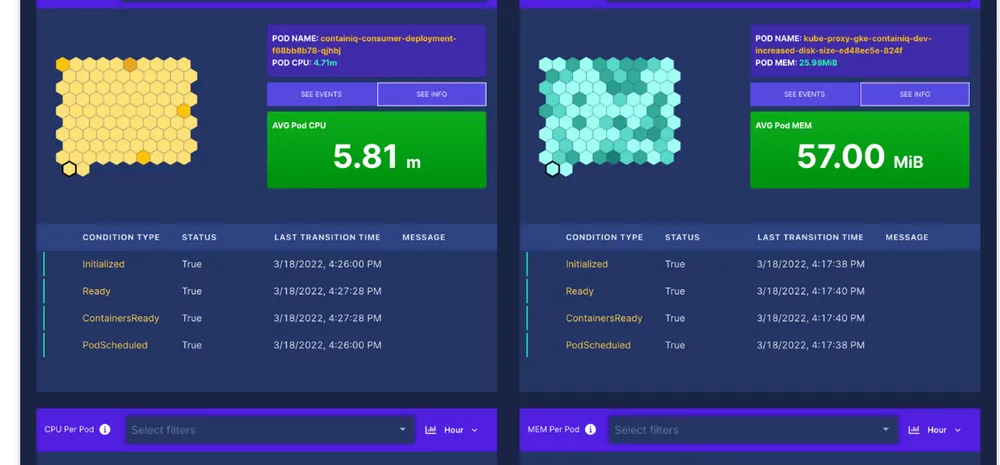
Another great option for monitoring your Kubernetes clusters with ease is ContainIQ. ContainIQ offers you a fully featured monitoring solution that’s focused on instantly monitoring Kubernetes. Their goal is to ensure that the installation of the product is quick and that your monitoring solution is ready to go right out of the box, complete with prebuilt dashboards that quickly integrate with your Kubernetes clusters.
ContainIQ has three features that make it a great monitoring option:
- A prebuilt service latency dashboard for Kubernetes;
- A prebuilt events dashboard for Kubernetes;
- A prebuilt Pod and Node metrics dashboard for Kubernetes;
- Integrates with Fluentd for log collection and visualization.
ContainIQ helps keep administrators and site reliability engineers focused on their core competency instead of investing valuable time and effort into your monitoring solution.
You can utilize Helm charts to install the product or a .yaml file that’s provided. ContainIQ uses multiple agents to collect data: one is installed as a single replica deployment that’s responsible for collecting metrics directly from the Kubernetes API, together with DaemonSets used to collect logs as well as latency data from all Pods on a given Node through eBPF.
For more information on ContainIQ, visit their documentation page.
Weave Scope

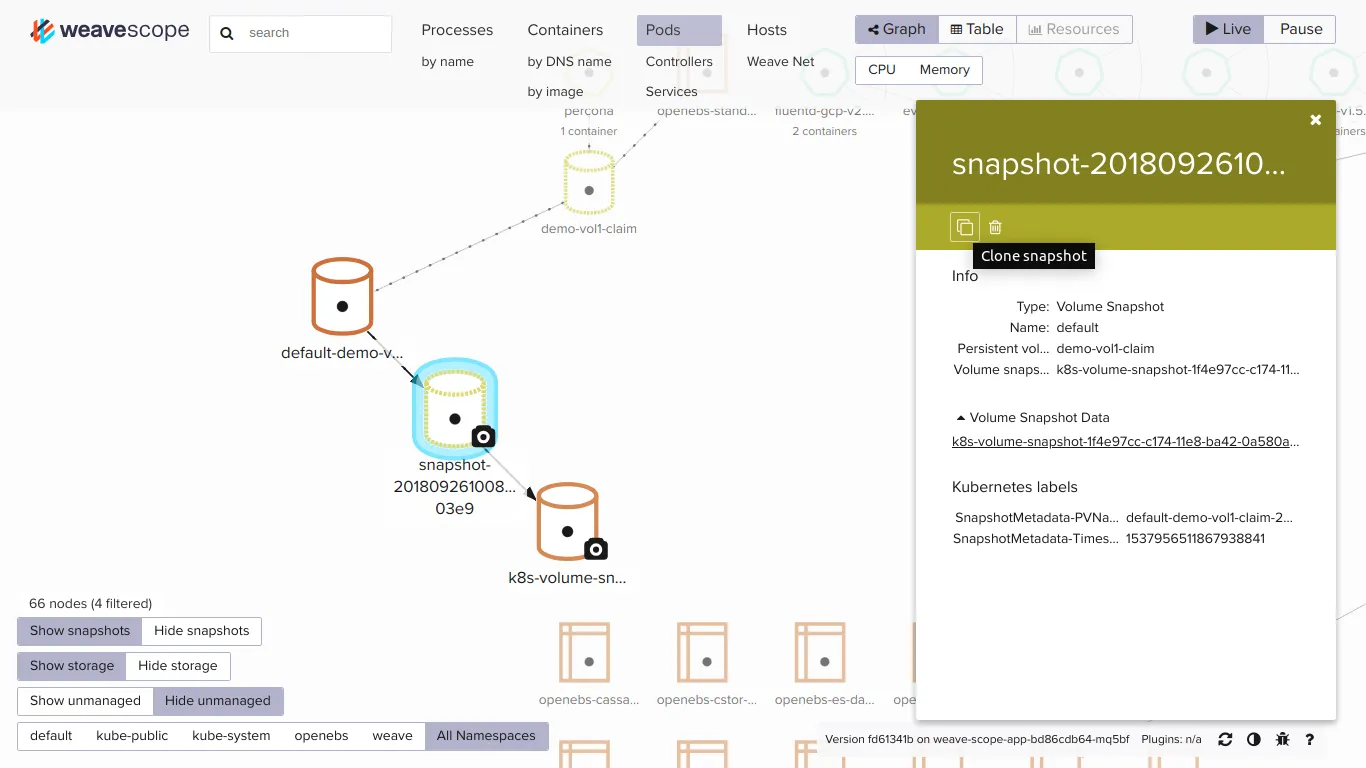
Weave Scope, developed by Weaveworks, is considered both a monitoring and a visualization tool for Docker containers and Kubernetes clusters and has a comprehensive list of features. Specifically, Weave scope:
- Enables you to build topologies of your applications and infrastructure;
- Incorporates views that let you filter your visualizations to reflect the various Kubernetes components;
- Provides a graphical overview mode and a more detailed table mode, enabling you to display metrics on Kubernetes components;
- Incorporates a powerful search tool that enables you to quickly pinpoint Kubernetes resources;
- Supports the management of containers from the scope browser itself;
- Incorporates a plug-in API, used for creating custom metrics.
Weave Scope can be installed as a stand-alone solution, or you can use Weave Cloud—their hosted solution. It can be installed with Docker in single-Node or cluster scenarios or using Docker Compose. It’s also supported across a number of container orchestration platforms like OpenShift, Amazon ECS, minimesos, and Mesosphere DC/OS.
For more information on Weave Scope, make sure you check out their documentation page.
New Relic And Pixie

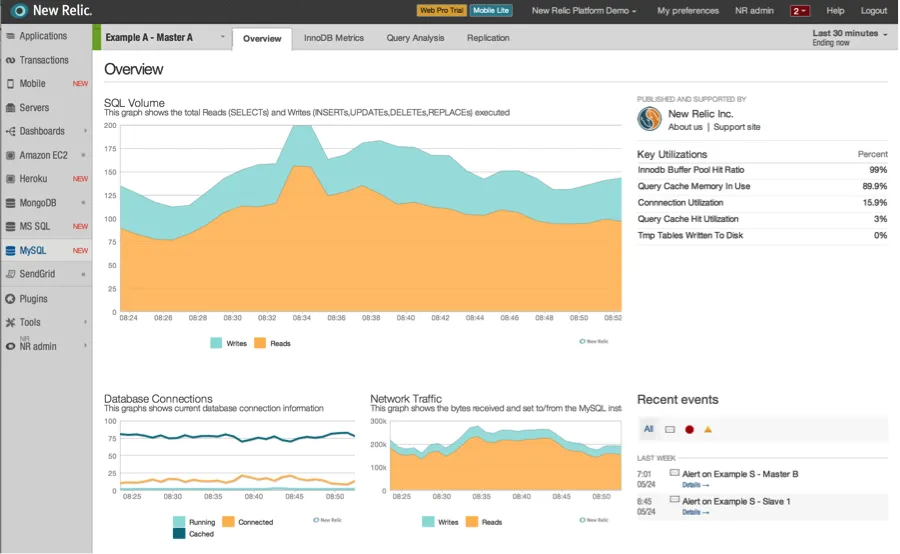
New Relic offers a full-stack analysis platform called New Relic One. With New Relic One, you have an entire list of monitoring and analysis capabilities:
- Application performance monitoring,
- Code debugging,
- Kubernetes monitoring with Pixie,
- Machine learning monitoring,
- Log management,
- Error tracking,
- Infrastructure monitoring,
- Network monitoring,
- Browser monitoring.
It supports a host of technologies as part of its monitoring platform, and its most recent acquisition of Pixie is particularly important. Pixie is a Kubernetes-based observability tool that collects data without the need to install any integrations or language agents. It’s supported on several cloud-hosted Kubernetes services, like Amazon EKS, Google Kubernetes Engine (GKE), Microsoft Azure Kubernetes Service, Red Hat OpenShift, and Pivotal Container Service.
Pixie has the ability to automatically collect metrics, events, logs, and traces from your Kubernetes clusters using Extended Berkeley Packet Filters (eBPFs). eBPFs are a Linux kernel technology that’s used to trace user-space processes. It’s used by Pixie to enable observability at the kernel layer, which offers users a deeper visibility into their Kubernetes clusters.
New Relic’s Pixie also provides you with a number of monitoring instrumentations that make up its full suite of features. Users have the option of installing any, or all, of the instrumentations as they see fit:
- Kubernetes infrastructure for system-level metrics;
- Kubernetes events for cluster-related events;
- Prometheus metrics to support data sourced from Prometheus endpoints;
- Kubernetes logs for control-plane data;
- Application performance for code-level metrics;
- Network performance monitoring for DNS, network mapping, flow graphs, etc.
For each of the instrumentations provided, there are two installation options: a guided install and the manual setup. The guided install can be used for a faster implementation, while the manual install option, which utilizes Helm, offers a more customized installation process.
To find out more about Pixie and the rest of the monitoring features offered by the New Relic platform, take a look at their Kubernetes monitoring guide.
Datadog

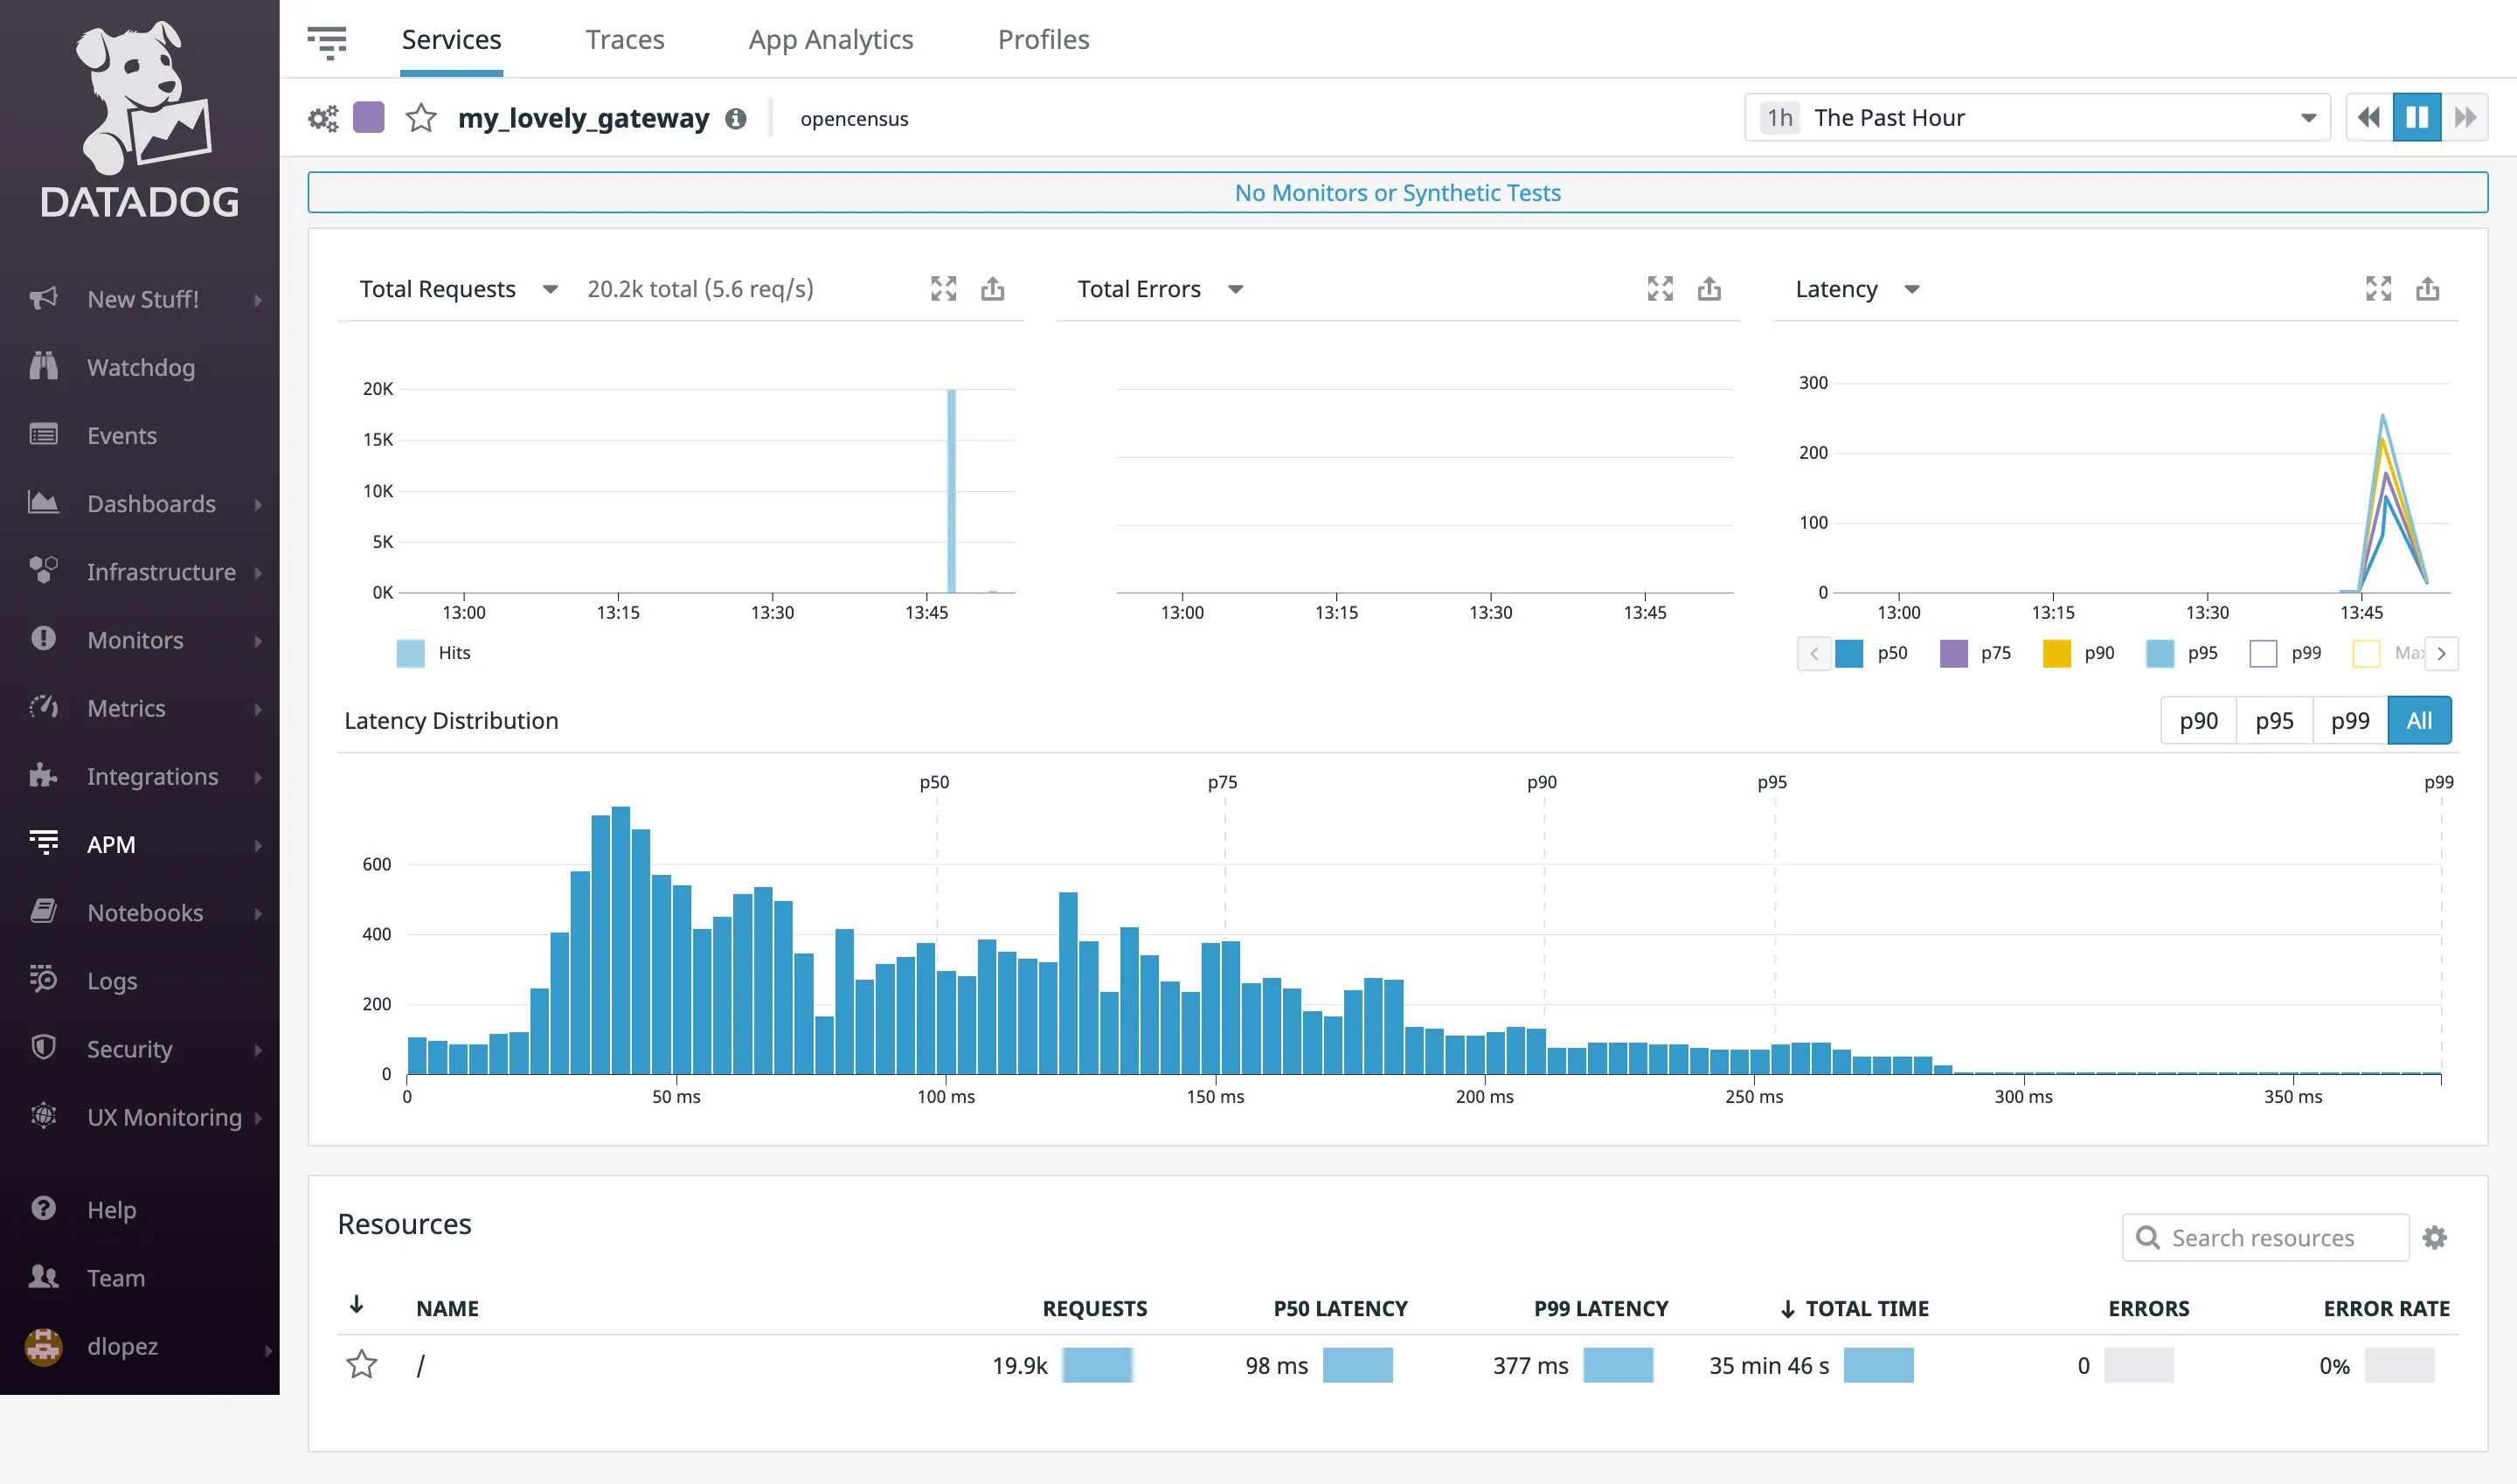
Datadog collects data using what’s called the Datadog Agent. Installed on each Node in your cluster, the Datadog Agent collects metrics, traces, and logs from each of the Nodes in your cluster, enabling you to monitor the overall health of your Nodes.
In addition, Datadog has an additional tool called the Datadog Cluster Agent that provides additional benefits, like monitoring Kubernetes at a slightly higher abstraction layer: the cluster level. Deploying the cluster agent is fairly straightforward: the install uses a manifest, and a Kubernetes Deployment and Service is deployed for the cluster agent.
Once your cluster agent and Node-based agents are deployed, metrics from your cluster will begin to stream to Datadog. Additionally, a built-in handy dashboard for visualizing your Kubernetes metrics is also included.
Datadog has a very healthy developer community, working on a number of product enhancements—matters like community-contributed APIs and DogStatsD client libraries. In fact, Datadog has a very active GitHub account, and they also hold regularly scheduled office hours for their open-source contributors. For a list of their open-source projects, check out Datadog’s GitHub profile.
For more information about monitoring Kubernetes using Datadog, check out this Monitoring in the Kubernetes Era article.
5 Kubernetes Monitoring Methodologies
After reading through the five tools covered above, it should hopefully be clear that it’s impossible to name a single tool as the best one. It all depends on your circumstances and the specific problems you want to solve. In other words, choosing a tool depends on knowing how you want it to be implemented, and ensuring that the tool you opt for supports that implementation approach.
Below are five popular monitoring methodologies, all of which can be implemented individually but prove most powerful when implemented in conjunction. Note that this is far from a comprehensive list of methodologies, but rather, some of the most commonly used and most effective in Kubernetes. You’ll also notice that they all cover one or more of the essentials detailed earlier in this post.
Metrics-Based Monitoring
No matter the type of infrastructure you’re monitoring, collecting, and analyzing, metrics is the most basic form of monitoring and should be strongly considered by everyone as the primary form of monitoring, and by extension, the first methodology you implement.
This methodology helps assess the overall health of your cluster, including key metrics like CPU, RAM, disk utilization, network utilization, etc. With these metrics collected, you can build powerful dashboards and alerts to help you stay aware of your system’s performance. In Kubernetes, this is often achieved using both Prometheus and Grafana.
Log-Based Monitoring
Collecting metrics is a great way of being alerted to failures, but it’s rarely useful in determining the root cause of the failure. Aggregating, storing, and analyzing log data is crucial for understanding what exactly happened at the time of failure.
This goes for every part of your infrastructure, whether it be from the control plane, Nodes, Pods, etc. Logs are an essential part of drilling down into the behavior of an application at any given time. And, with the right tool, you can quickly use these logs to identify patterns and ultimately determine errors. Logs in Kubernetes are often collected using Fluentd, Elasticsearch, and Kibana.
Tracing-Based Monitoring
As covered in the monitoring essentials, being able to follow a request path through multiple services is a crucial part of having a holistic overview when drilling down into failures. But, tracing is often useful even outside of troubleshooting.
A complete overview of a request path helps determine performance bottlenecks or latency issues, and in general gives you a much better understanding of how your services interact. This can be very useful when trying to determine what service needs to be optimized. Popular tools to achieve this are Jaeger and Zipkin.
Configuration Monitoring
Sometimes errors aren’t happening as a result of bad code being deployed, but rather, by errors in configuration. Most recently this was demonstrated by a single Twitter engineer. Because of this, it’s important to track your cluster’s configuration, such as deployments, ClusterRoles, and ConfigMaps.
By monitoring configuration changes, you can quickly identify and address misconfigurations or unauthorized modifications. Gatekeeper is a popular tool for implementing this type of monitoring.
Application Performance Monitoring (APM
)
APM focuses on monitoring application-specific metrics like response times, error rates, and throughput. APM is widely used, also outside of Kubernetes. It still deserves a mention in this Kubernetes-specific approach, however, as it can often provide incredibly valuable insight into the performance and shortcomings of your application. Often, an APM tool will include some of the other methodologies mentioned here, like metrics-based and log-based management, and often also tracing-based monitoring.
APM tools provide deep insight into the performance of your application, enabling you to identify and resolve application-level issues. Popular APM tools include Datadog, New Relic, and Dynatrace.
The Importance of Kubernetes Monitoring
In this article, you’ve learned about the industry’s best options for monitoring your Kubernetes clusters. Each of these products has distinct features that make them unique, but all of them perform data collection, support data visualization, and provide a means to be alerted when issues arise. There are other monitoring tools out there, but what’s most important is choosing the right monitoring solution that will aid you in managing and maintaining your containerized infrastructure.
More and more, applications are containerized, and applications are designed using microservice architectures. This ultimately means that the use of your container orchestration platform(s) will only continue to grow. Monitoring and observability are two of the sciences behind understanding the behaviors of your containerized applications, the orchestration platforms themselves, and even the physical Nodes that host these solutions. You’ve got a choice to make—so make it count!