Oracle JDK to OpenJDK: A Guide to Reliable Migration Testing
TL;DR
One of the most common infrastructure changes Java developers and operators are dealing with today is the migration from Oracle Java to OpenJDK. The reason is the licensing changes made by Oracle and the maturity of the OpenJDK distributions. The migration process is quite simple: replace the JDK, recompile the code, and redeploy the application. However, the differences between the two runtimes can lead to unexpected issues that are not caught by unit tests. In this post, you will learn how to use the traffic replay functionality of Speedscale to record the traffic of your Oracle JDK-based Java deployment, replay it against the same application running on OpenJDK, and compare the results to ensure all issues are caught before the users are impacted.
What makes this migration more complicated than it seems
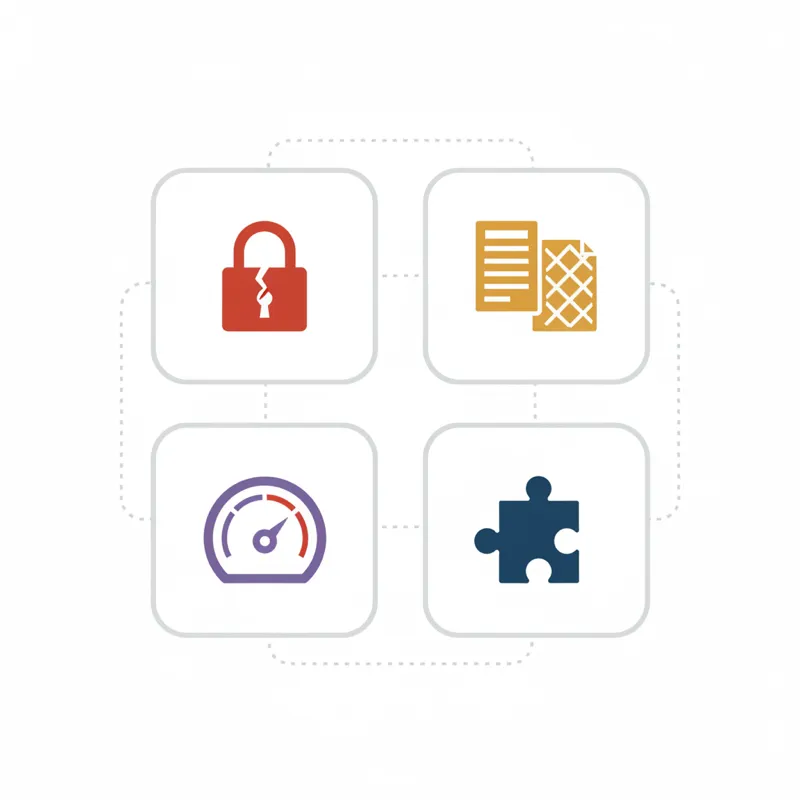
Although the codebase of the Oracle JDK and the OpenJDK is the same, the reality is that the differences between the two can cause unexpected issues. As you are probably aware, the Oracle JDK codebase has been open-sourced starting with Java 11. As a result, the Oracle JDK and the OpenJDK are functionally identical for the vast majority of use cases. However, functional equivalence is not the same as identical. The differences between the two can cause unexpected issues that are not caught by unit tests. Here are the categories of issues that can occur during the migration process.
TLS and cryptographic behavior
The differences between the Oracle JDK and the OpenJDK can also manifest as differences in the cryptographic providers that are being used. The Oracle JDK has historically included its own cryptographic provider. As a result, the default provider chain is different from the default provider chain of the OpenJDK.
- Different default protocol versions (e.g., TLSv1.2 vs TLSv1.3 negotiation ordering)
These issues are particularly problematic as they will only become apparent when your application talks to specific external systems, which is not something a unit test would catch.
Serialization and encoding
Java serialization can behave differently across different JDK versions. If your application uses:
ObjectOutputStream/ObjectInputStreamfor caching or message passing- XML marshalling using JAXB (now removed from JDK in Java 11)
- Customised
toString()output included in API responses - Locale-sensitive string formatting (e.g., number formatting, date formatting)
Then you may experience different byte-level output when using OpenJDK compared to Oracle JDK, leading to parse errors or cache misses.
Garbage collection and performance
Oracle JDK and OpenJDK can have different default garbage collection algorithms depending on their version. Moving from Oracle JDK 8, which defaults to parallel garbage collection, to an OpenJDK 17 or 21 distribution, which defaults to G1 garbage collection, will change your application’s performance characteristics. Your application’s response time p99 will change by a significant amount without any code changes.
Removed and relocated APIs
If you’re skipping a version of the JDK as part of your migration (e.g., Oracle JDK 8 to OpenJDK 17 or 21), you will encounter removed or relocated APIs:
javax.xml.bind(JAXB) - moved to Jakarta EEjavax.activation- removedjava.corba- removedsun.misc.Unsafe- partially removed- JavaFX - removed, available as a separate project
These will cause compile-time errors, which will be easy to correct, but runtime differences in the replacement libraries will be harder to understand.
Why traffic replay is the right tool for the job
Existing testing methodologies are insufficient for JDK migrations:
- Unit tests test the logic of your code but do not test the runtime behavior of the JDK. If you change the serialization of
java.util.HashMapin a way that changes the order of the map entries, a unit test will only detect this if you specifically write a test for this behavior. - Integration tests are more effective but only cover a limited number of successful scenarios. In reality, the number of edge cases is enormous.
- Manual testing is impossible to scale and still won’t cover the vast number of API interactions a real system experiences in a day.
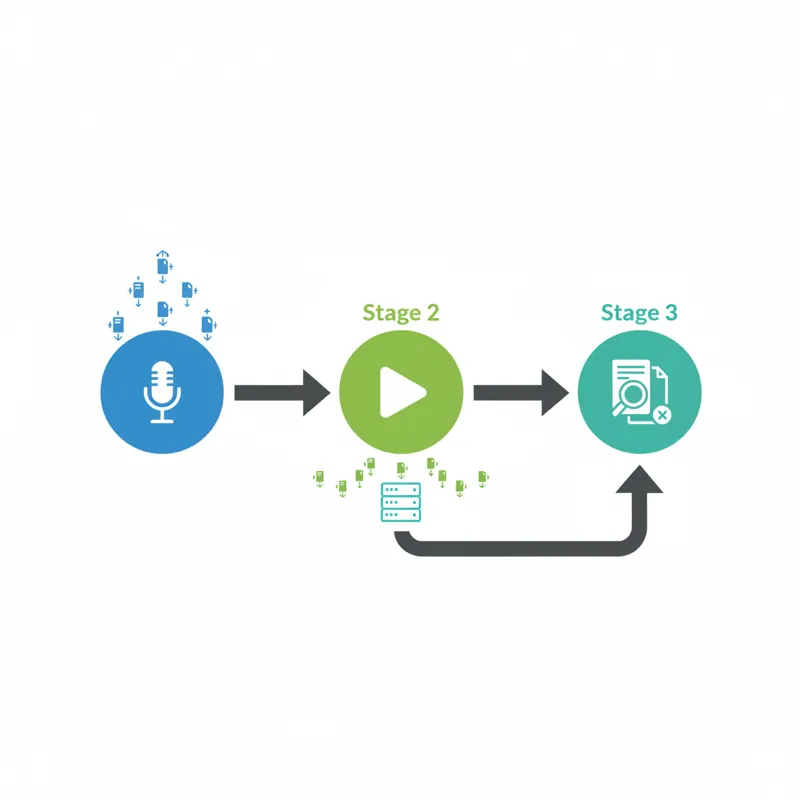
This is where traffic replay comes in. By capturing the real traffic of a system – i.e., every API call, database query, and interaction with a service – you automatically create a comprehensive test suite. And by replaying this traffic against the new OpenJDK version, you get a pixel-perfect view of the differences in behavior between the old and new system.
Speedscale makes this process efficient by:
- Recording all traffic, not just the traffic the API receives, but also the traffic it sends to the database, cache, and services it depends on
- Mocking backend dependencies to replay the traffic without requiring a real environment
- Automatically diffing the response between the original traffic and the replayed traffic
- Integrating into CI/CD – so you can gate your OpenJDK deployment based on passing replay tests
Step-by-Step: Validating Your Migration with Speedscale
Prerequisites
- Kubernetes cluster with your Java application deployed with Oracle JDK
- Speedscale operator installed
speedctlCLI tool installed locally- Your application deployed as Kubernetes Deployment, StatefulSet, or DaemonSet
Step 1: Instrument Your Oracle JDK Deployment for Recording
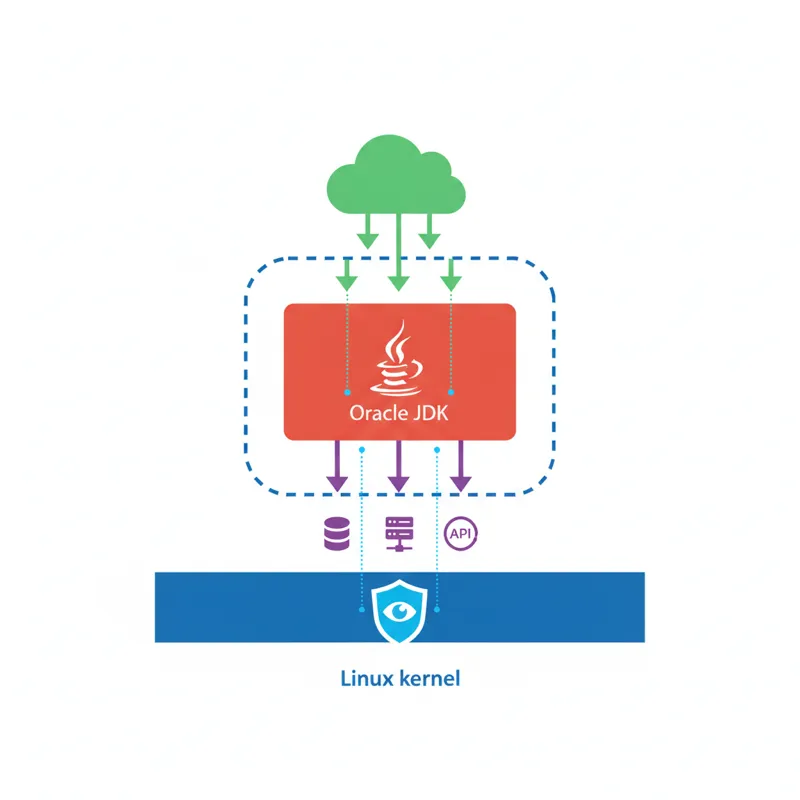
Before you start, make sure the Speedscale operator is installed in your cluster. For the best results, we recommend the eBPF collector, as it collects all the traffic at the kernel level without the need for sidecars in your pods. That means zero changes are needed to your application containers. The eBPF collector also automatically collects all the inbound and outbound TLS traffic, so you get all the encrypted calls to your downstream services out of the box, without the need for configuration changes.
Next, click Add Service in the Speedscale UI and then choose the environment where your Oracle JDK application is running. Speedscale can remotely instrument most Kubernetes applications without the need for you to touch the cluster itself. There are no changes needed to your application deployment manifests, and we don’t require you to redeploy your application. The eBPF collector collects all the traffic flowing through your application at the network level, including TLS-encrypted connections, without the need for modifications to your pods.
For more advanced configurations, see the Getting Started guide.
Let this instrumented deployment run under normal production traffic for a representative period. What this means will vary depending on your application:
- API services: A few hours during peak traffic should be representative of all API endpoints and parameter combinations.
- Batch processors: At least one entire batch cycle.
- Event-driven services: A representative period should be long enough to capture all varieties of events.
- Stateful services: Don’t forget to capture your application startup, as you want to capture cache warming, connection pool initialization, etc.
The eBPF collector will capture all of this: HTTP requests and responses, gRPC calls, database queries over JDBC, Redis commands, etc. Each of these interactions will be captured as an RRPair — the smallest unit of traffic.
Step 2: Create a snapshot
After you’ve captured a representative period of production traffic, you’ll want to create a snapshot. A snapshot is a carefully selected set of RRPairs, which will be our test set.
You can create a snapshot from the Speedscale UI by going to Traffic Viewer, filtering on your service and recording time window, and clicking “Create Snapshot”. Or, you can use our CLI:
speedctl create snapshot my-java-service \
  --start "2026-02-10T00:00:00Z" \
  --end "2026-02-13T00:00:00Z" \
  --name "oracle-jdk-baseline"
You should review your snapshot in Traffic Viewer to ensure it has captured all the traffic you expect. Pay close attention to:
- Inbound traffic: This will be our tests. All API calls your service has received will be replayed against our OpenJDK build.
- Outbound traffic: These will serve as your mocks. The database queries, API calls, and cache queries will all be mocked via the Speedscale responder.
Step 3: Build and deploy your OpenJDK image
Next, you’ll build the same application with the OpenJDK. If you’re staying on the same version (for example, from the Oracle JDK 17 to the Eclipse Temurin 17), this is typically just the base image being swapped out:
# Before - Oracle JDK
FROM container-registry.oracle.com/java/jdk:17

# After - Eclipse Temurin / OpenJDK
FROM eclipse-temurin:17-jre-jammy

COPY target/my-java-service.jar /app/my-java-service.jar
ENTRYPOINT ["java", "-jar", "/app/my-java-service.jar"]
If you’re also moving to a different major version (for example, from the Oracle JDK 8 to the OpenJDK 21), you’ll also need to fix up the changes that were made to your code to work with the new version. Once you’ve got that working, you can move on to the replay step.
Deploy your OpenJDK build to your staging or test namespace.
Step 4: Replay the snapshot against your OpenJDK deployment
Replay your Oracle JDK baseline snapshot against your newly created OpenJDK deployment. In the Speedscale UI, navigate to your snapshot and click Replay. Select your OpenJDK test workload as the target, and Speedscale will take care of the rest. The generator will send the recorded inbound traffic to your app, while the responder will mock all the outbound dependencies with the recorded responses.
Alternatively, you can also use the speedctl command to initiate the replay from the command line:
speedctl replay my-java-service \
  --snapshot "oracle-jdk-baseline" \
  --namespace staging \
  --test-config standard
During the replay process, Speedscale will:
- Deploys a generator pod, which replays all the recorded incoming requests to your OpenJDK application
- Deploys a responder pod, which intercepts all the outgoing calls and returns the recorded responses
- Records the actual responses returned by your OpenJDK application
- Compares these with the expected responses returned by the Oracle JDK recording
Step 5: Analyze the replay report
Finally, open the replay report in the Speedscale UI. Here, you can see the following information:
Response correctness: Are the response bodies the same? Speedscale compares the responses field by field, so you can see exactly what changed in the JSON fields, XML elements, or headers.
Some common differences you may see include:
| Issue | Example | Root cause |
|---|---|---|
| Date formatting change | 2026-02-13T19:00:00.000+0000 vs 2026-02-13T19:00:00.000Z | Different SimpleDateFormat timezone handling |
| Header ordering | X-Custom-Header header position changed | HashMap iteration order changed |
| TLS failure | Outbound call to payment gateway returns 0 bytes | Cipher suite mismatch |
| Numeric precision | 0.30000000000000004 vs 0.3 | Float/double serialization difference |
| Missing response field | jaxbElement field missing | JAXB replaced with Jackson but mapping differs |
Latency comparison: Are the response latencies comparable? Compare the p50, p95, and p99 latencies. Changes in GC behavior may cause latency spikes that are not apparent in functional testing. For more on how you can incorporate performance testing into your workflow, see A Developer’s Guide to Continuous Performance Testing.
Error rate: Did the requests that worked with the Oracle JDK fail with the OpenJDK? You can filter the report by status code to see 500s, 502s, and connection timeouts.
Step 6: Fix, rebuild, replay — iterate until clean
For every regression found in the replay report:
- Diagnose: Use the RRPair diff to locate the exact change. Speedscale displays the recorded (expected) response and the replayed (actual) response.
- Fix: Modify the application code or configuration to match the expected behavior. This could be adding a cipher suite configuration, a date format pattern, or replacing a removed API.
- Rebuild: Push a fresh OpenJDK image.
- Replay again: Use the same snapshot to replay the request to the fresh image.
Repeat until the replay report is clean, indicating zero regressions in the response correctness and acceptable latency variance.
Step 7: Gate your CI/CD pipeline
Now that you’ve validated the migration in the staging environment, you should also enable replay tests in your CI/CD pipeline so that all future changes are continuously validated against the same baseline of production traffic. Check the Speedscale CI/CD integration guide for setup instructions for GitHub Actions, GitLab CI, Jenkins, Azure DevOps, CircleCI, and more.
This ensures that even after the initial migration, subsequent code changes don’t introduce regressions that interact badly with the new JDK runtime.
Using proxymock for local validation
Instead of using Speedscale in the cluster, you could also use proxymock to validate the migration before deploying it to the cluster. Check the proxymock page to learn about the alternative. If you choose to use proxymock, check the proxymock getting started guide to learn the details about the setup.
Note: The above command only records inbound traffic. If you are making outbound calls to databases, APIs, etc., you will need to set custom command line arguments or environment variables to capture this. Check out the proxymock docs for proxy config and outbound capture.
Record Locally with Oracle JDK
# install proxymock
brew install speedscale/tap/proxymock

# start recording
proxymock record --app-port 8080

# in a new terminal, start your app with oracle JDK
java -jar my-java-service.jar

# simulate some traffic or use a pre-built test suite
curl http://localhost:4143/api/health
curl http://localhost:4143/api/users
curl http://localhost:4143/api/orders

# stop recording
Replay with OpenJDK
# start a mock server with the recorded traffic
proxymock mock --in-dir ./proxymock/recorded

# in a new terminal, start your app with OpenJDK
export JAVA_HOME=/path/to/openjdk-17
java -jar my-java-service.jar

# replay the recorded inbound traffic
proxymock replay --in-dir ./proxymock/recorded --test-against http://localhost:8080

# compare results
proxymock compare ./proxymock/recorded ./proxymock/replayed
The output of this command will show you exactly where the OpenJDK response differs from the Oracle JDK baseline, just as you would expect from running this workflow on our cloud-based tool.
Migration Checklist
Before you consider this migration complete, be sure to:
- All API Endpoints produce identical response bodies, or you’ve documented intentional differences
- Latency p99 is within an acceptable variance of the Oracle JDK baseline
- TLS connections to all downstream services
- Serialization format (JSON, XML, Protobuf) is byte compatible where necessary
- Database queries produce the same results
- Cache hit rates remain the same (watch out for serialization-based cache keys!)
- Scheduled jobs and batch processes work correctly
- JVM flags are correctly mapped to OpenJDK flags (some Oracle flags don’t exist in OpenJDK!)
- Monitoring and APM tools are compatible with the OpenJDK JVM
- Replay tests are integrated into the CI/CD workflow to catch any regressions introduced in subsequent updates
Conclusion
While migrating from Oracle Java to OpenJDK is a necessary step for many organizations, it doesn’t have to be a leap of faith. By using Speedscale to record production traffic, you automatically create a test suite that exercises all the complexity of your application in production. By replaying that traffic through the OpenJDK JVM, you automatically exercise all the ways in which the Oracle JVM and OpenJDK JVM might be different – and catch all the ways in which the Oracle JVM and OpenJDK JVM are different before they ever reach production.
The record-replay-compare pattern makes the Oracle-to-OpenJDK migration a methodical and iteratable process. And once you’ve made the switch, the same pattern continues to protect you from regressions in every subsequent release. See how Speedscale works or book a demo to validate your migration with production traffic.