Part 3: Building a Production-Grade Traffic Capture and Replay System
At a previous company, we had over 100 microservices. I’d make what seemed like a simple change to one service and deploy it, only to discover it broke something completely unrelated. A change to the user service would break checkout. An update to notifications would break reporting. We spent more time fixing unexpected bugs than shipping features.
The problem was our test scenarios were too simple. Production traffic had edge cases, timing dependencies, and integration patterns we never thought to test. That’s what drew me to Speedscale. A chance to build a traffic replay platform to catch these issues before release by using actual production patterns.
This is the third post in a 3-part series:
- How to build a traffic capture system
- How to build a traffic transform system
- How to build a traffic replay system (you’re here)
You’ve captured production traffic (Part 1) and identified what needs to transform (Part 2). Now replay it against your new code to validate changes. This is fundamentally a big data problem: you have tons of traffic, storage is cheap, so use it.
The Core Problem
Replaying traffic means taking captured request/response pairs and sending them to your service under test. Sounds simple, but three problems emerge immediately:
State mismatch: Captured traffic references data that doesn’t exist in your test environment. A request updating order_123 fails because that order only exists in production. When simple test scenarios miss edge cases, users may encounter unexpected errors, usability issues, or technical problems that only appear in real-world situations.
Time staleness: Timestamps, JWT tokens, and date ranges become invalid the moment you capture them. A token captured today will no longer be valid tomorrow.
Non-determinism: Responses contain generated UUIDs, timestamps, and random values. Exact byte comparison fails 100% of the time.
The solution is selective mocking with transformed traffic. Replay inbound requests to your service with a live database, but mock downstream dependencies. By focusing testing effort on critical paths and high-impact areas, you can maximize the return on effort and reduce unnecessary work. Transform time-dependent values before replay.
Replay Strategies
Direct Replay Load Testing
Send captured requests directly to your service in a test environment. Typically, this is done by generating pcap files using tools like tcpdump or Wireshark, then replaying the traffic with a load test tool like k6 or jmeter to simulate real-world scenarios. Works for stateless, read-only endpoints with minimal dependencies.
Limitations: Requires identical environment setup, breaks when dependencies are unavailable, no control over side effects. Unfortunatley the real world is typically more complex so this falls down after “hello world”.
Shadow Production Traffic
Duplicate live production traffic in real-time to a new version of your service. Original requests go to production; copies go to your new version with responses discarded.
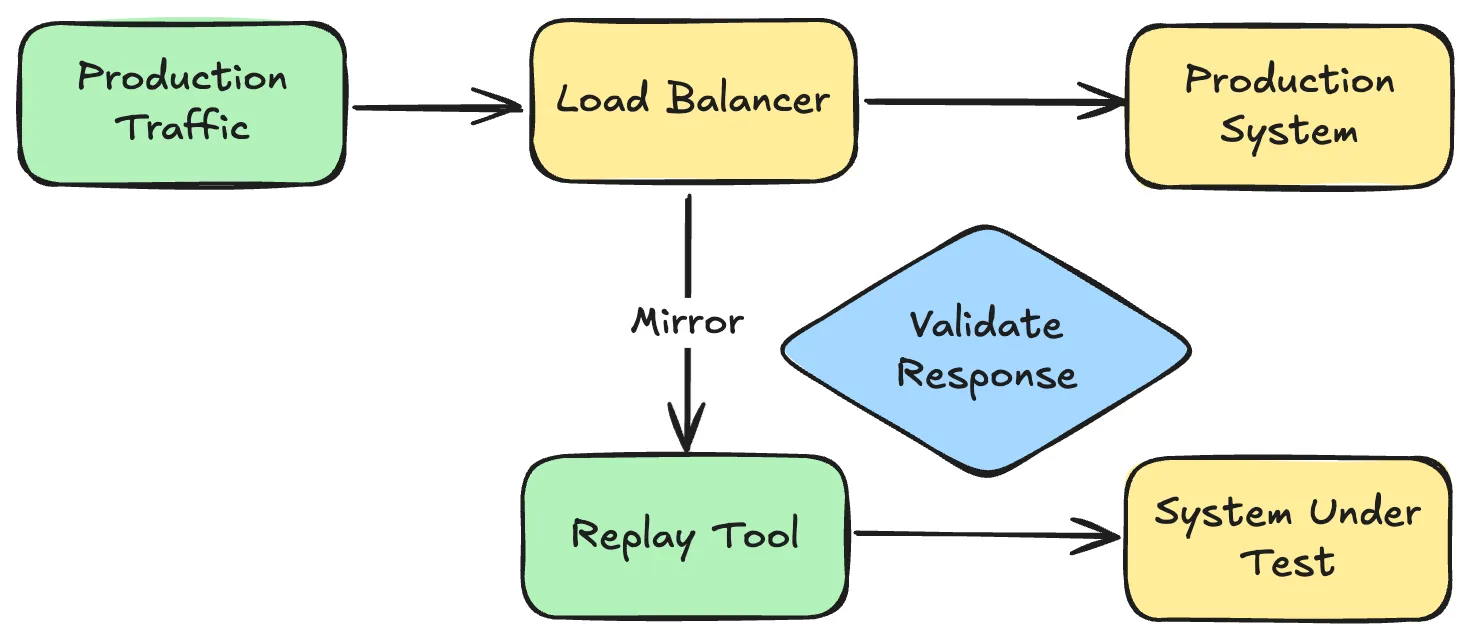
Pros: Immediate validation with real traffic patterns.
Cons: If your service writes to a database, you need to handle migrations and data cleanup. Bugs write bad data that must be backed out. It is very tricky to validate responses or test failure scenarios in isolation. You need an easy way to flip the switch between environments during shadow traffic testing to ensure a smooth transition.
Use for: Read-heavy services, performance validation, when you need immediate production-scale testing.
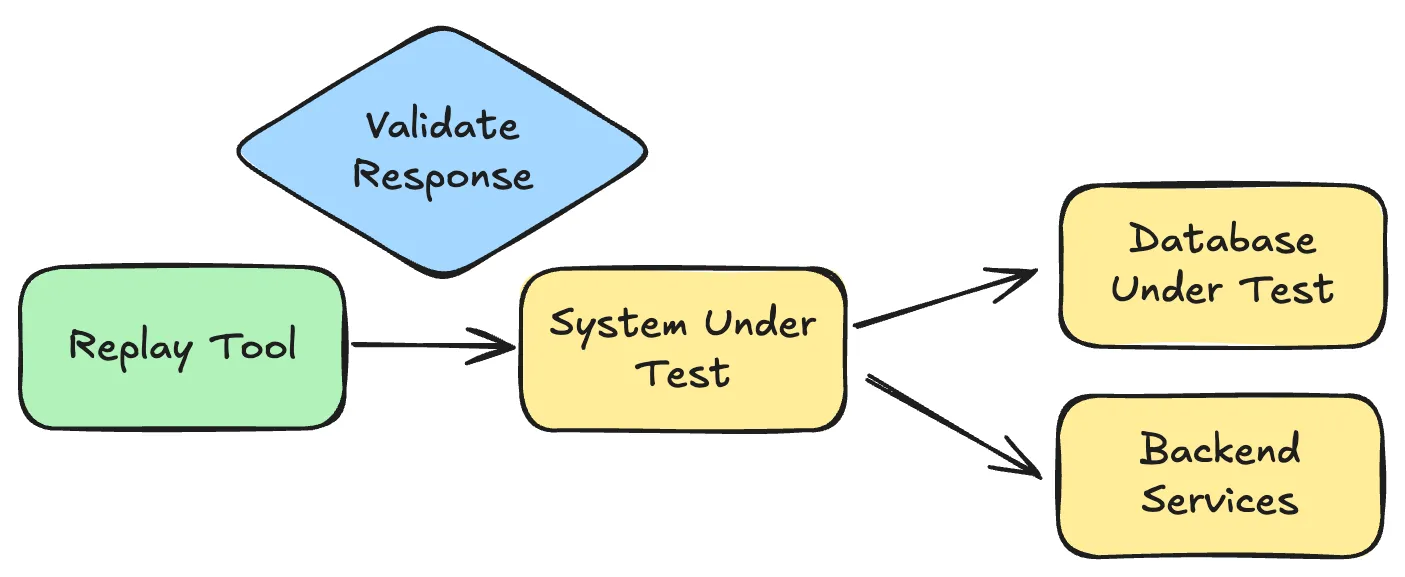
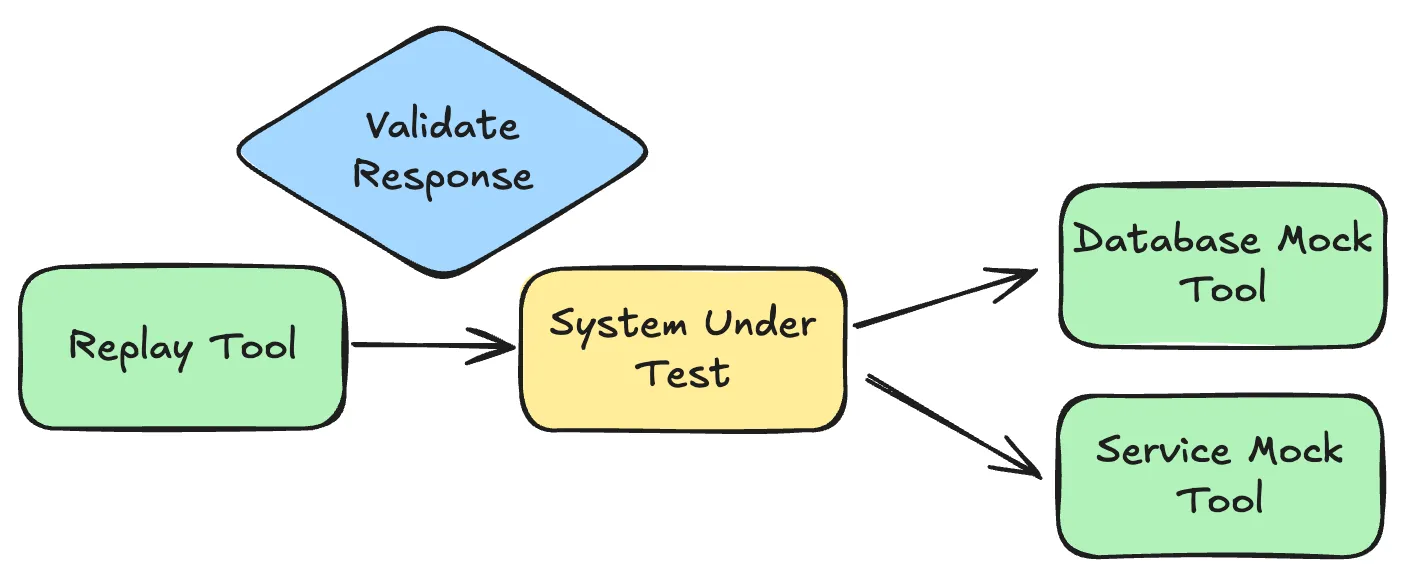
Replay Traffic with Service Mocks
Replay captured inbound traffic to your service while mocking downstream dependencies. Your service and database run live in a test environment; external APIs and other services are mocked. This works great to isolate your code from everything outside of your control for comprehensive testing and code analysis.
This is the sweet spot. Test failures are good because they mean you found bugs before production. You can run tests repeatedly, validate responses in detail, no risk of corrupting production data. Mix production traffic with locally captured traffic from proxymock to cover both production patterns and new code paths.
Setup:
replay:
  target: http://service:8080
  traffic:
    - ./prod-traffic/         # Production patterns
    - ./local-traffic/        # New endpoints from proxymock
  mocks:
    - service: postgres-mock
      port: 5432
      traffic: ./prod-traffic/postgres/
    - service: payment-api
      port: 8081
      traffic: ./prod-traffic/payment-api/
Building the Traffic Replay Tool
Architecture
Four components work together:
-
Traffic Store: S3, filesystem, or database storing transformed request/response pairs. Transformation happened in Part 2—timestamps replaced with
{{now}}, IDs mapped, tokens identified. Store organizes by timestamp, endpoint, and session. -
Replay Orchestrator: Decides which traffic to replay, ordering, and speed. Handles timing between requests and parallelization. Injects runtime variables like
{{now}}right before sending. The replay engine creates an authentic simulation of user interactions, resulting in more accurate and realistic testing environments. -
Response Validator: Compares actual vs expected responses with configurable fuzzy matching.
-
Results Reporter: Aggregates pass/fail results, diffs, and timing data.
Key insight: Transformation is done once in advance (Part 2) for performance. At replay time, we only inject runtime variables:
function injectRuntimeVars(request) {
    // Simple string replacement for runtime values
    return request
        .replace(/{{now}}/g, new Date().toISOString())
        .replace(/{{uuid}}/g, crypto.randomUUID());
}
This is much faster than applying full transformation rules on every replay.
Timing and Ordering
Preserve temporal relationships between requests in a session. Maintaining high traffic quality during replay is essential for precise testing and accurate performance assessment, as it ensures the replayed scenarios closely reflect real-world network conditions. Here’s an example using Grafana k6:
import http from 'k6/http';
import { sleep, check } from 'k6';

const requests = JSON.parse(open('./captured-traffic.json'));

export default function() {
    let baseline = requests[0].timestamp;

    requests.forEach(req => {
        sleep(Math.min((req.timestamp - baseline) / 1000, 5.0));

        const body = injectRuntimeVars(req.body);
        const response = http.post(req.url, body);

        check(response, {
            'status matches': (r) => r.status === req.expectedStatus
        });

        baseline = req.timestamp;
    });
}
Key decisions: Replay sessions sequentially to preserve state dependencies. Run multiple sessions in parallel with k6 VUs for isolated state. Cap delays to speed up tests.
Mock Setup
Use captured outbound traffic to configure mocks. When your service calls a dependency, the mock returns the captured production response. Most teams use WireMock or MockServer for this:
// Configure WireMock stubs from captured traffic
const outboundTraffic = JSON.parse(open('./outbound-traffic.json'));

outboundTraffic.forEach(({ request, response }) => {
    http.post('http://wiremock:8080/__admin/mappings', JSON.stringify({
        request: {
            method: request.method,
            urlPath: request.path
        },
        response: {
            status: response.status,
            body: response.body,
            headers: response.headers
        }
    }), {
        headers: { 'Content-Type': 'application/json' }
    });
});
Response Validation
k6 provides built-in validation with check(). Focus on status codes and key business fields:
Tip: This example checks that response status codes are 200. Your script should extend this to validate response bodies and other business-critical fields.
Replays of real user sessions can also be used to identify usability issues and performance problems by reproducing actual traffic patterns during validation.
import { check } from 'k6';

// Validate response
check(response, {
    'status is 200': (r) => r.status === 200,
    'has orderId': (r) => JSON.parse(r.body).orderId !== undefined,
    'total is correct': (r) => JSON.parse(r.body).total === expectedTotal
});
For more complex validation, k6’s chai assertions provide expect-style matching.
Replay Orchestration (Phased Environment Bring-up)
Before you press “play” on traffic, bring the environment up in phases and promote only when stable. Plan bottom-up:
Phase 1: Backends (foundation)
- Mock servers: Replace external HTTP dependencies with mocks (WireMock/MockServer). Use captured outbound traffic to build stubs. Gate: mock match rate ≥ 98%, unmatched calls = 0, p95 dependency latency within historical range.
- Mock databases: Use protocol-aware fakes or record-and-reply stubs only when true DB state is hard to seed. Gate: query match coverage ≥ 95%, no unhandled SQL.
- Real servers: For critical cross-service contracts, point to real services in an isolated namespace. Gate: no cross-namespace egress, auth works, rate limits disabled or raised.
- Real databases: Prefer a real DB for the SUT with isolated data. Gate: schema at target migration, read/write paths validated, rollback/restore tested.
Example (conceptual) orchestration inputs:
orchestration:
  phase: backends
  mocks:
    - name: payment-api
      type: http
      image: wiremock/wiremock:3
      stubs: ./prod-traffic/payment-api/
      gates:
        match_rate: ">= 0.98"
        unmatched_requests: "== 0"
    - name: postgres-mock
      type: db
      traffic: ./prod-traffic/postgres/
      gates:
        query_match_rate: ">= 0.95"
  real:
    - name: catalog-svc
      namespace: replay
      gates:
        readiness: "true"
        latency_p95_delta: "<= +10%"
Promote to the next phase only when all backend gates are green.
Phase 2: System Under Test (applications)
Deploy the service(s) you are testing with production-like config but isolated data.
- Readiness: health checks green for N minutes, migrations complete, caches warm.
- Stability: logs free of new errors, CPU/mem steady, connection pools healthy.
- Isolation: SUT only talks to mocks/approved real services.
orchestration:
  phase: sut
  apps:
    - name: orders-svc
      image: ghcr.io/acme/orders:pr-123
      env:
        DATABASE_URL: postgres://...
        PAYMENT_API_URL: http://payment-api.mock:8080
      gates:
        ready_seconds: ">= 120"
        error_rate: "== 0"
        cpu_delta: "<= +15%"
        mem_delta: "<= +15%"
Phase 3: Quality Gates
Define objective gates so promotion is automatic:
- Status codes: distribution matches baseline; 5xx = 0; pass rate ≥ 99%.
- Body comparisons: JSON-path scoped compare with tolerances and ignored fields (timestamps, UUIDs). Field-level match rate ≥ 95%.
- Performance: p95 latency delta ≤ +10%; throughput within ±10% of baseline; error budget unchanged.
- Resources: CPU and memory deltas ≤ +15%; GC pauses not worse than baseline; DB connection pool saturation unchanged.
- Mocks: match rate ≥ 98%; unmatched = 0; new unmatched samples are captured as candidates for new stubs.
- Side effects: write counts, emitted events, and external calls match baseline within agreed bounds.
Example gate configuration:
quality_gates:
  status_pass_rate: ">= 0.99"
  body_match_rate: ">= 0.95"
  mock_match_rate: ">= 0.98"
  latency_p95_delta: "<= +10%"
  cpu_delta: "<= +15%"
  mem_delta: "<= +15%"
These gates govern promotion to Phase 4.
Telemetry and Observability Mapping
Instrument every layer and tie signals back to the replay run ID:
- Mocks: request count, match vs. miss rate, per-endpoint latency, fallback usage; persist unmatched examples for new stubs.
- SUT: logs, traces, CPU, memory, GC, error rate, p50/p95/p99 latency, open connections, threadpool saturation; DB read/write counts.
- Replay controller: sent/received, pass/fail counts, backpressure, queue depths.
- Baseline: previous run or golden snapshot for deltas (latency, resource, correctness).
Tip: export all metrics with labels like run_id, service, endpoint, phase so reports can slice by phase and endpoint.
Mapping back to the design in this post:
- Traffic Store supplies fixtures for mocks and expected responses.
- Replay Orchestrator runs phases, enforces readiness/quality gates, and controls timing.
- Response Validator computes correctness metrics (status/body diffs) and exposes pass rates.
- Results Reporter joins correctness, performance, and mock metrics to baseline and emits the final verdict.
If any gate fails, keep artifacts, roll back to Phase 1 or 2 (depending on failure), and iterate.
Phase 4: Traffic Replay (inbound)
Only after backends and SUT are stable and Phase 3 gates are defined, start replay.
- Workload: sessions ordered, concurrency sized, timing caps defined.
- Cutoffs: abort on excessive 5xx, exploding latency, or mock miss spikes.
- Artifacts: collect responses, diffs, metrics, and coverage.
orchestration:
  phase: replay
  traffic:
    sources: ["./prod-traffic/", "./local-traffic/"]
    concurrency: 10
    time_scale: 10x
State Management
The hardest problem in replay is ensuring the right data exists in your test database. By capturing and storing network traffic in a file, such as a PCAP file, you can accurately replay real scenarios for testing and troubleshooting, ensuring that the replayed data matches actual production conditions.
Transaction Isolation
Wrap each replay session in a transaction and rollback. Here’s a pattern using a setup/teardown script:
import { check } from 'k6';
import sql from 'k6/x/sql';

const db = sql.open('postgres', 'postgres://user:pass@localhost/testdb');

export function setup() {
    // Begin transaction
    db.exec('BEGIN');

    // Seed required state
    const sessionData = JSON.parse(open('./session-data.json'));
    seedDatabase(db, sessionData);

    return { sessionData };
}

export default function(data) {
    // Replay requests with seeded state
    data.sessionData.requests.forEach(req => {
        const response = http.post(req.url, req.body);
        check(response, { 'valid': (r) => r.status === req.expectedStatus });
    });
}

export function teardown(data) {
    // Rollback everything
    db.exec('ROLLBACK');
    db.close();
}

function seedDatabase(db, sessionData) {
    // Extract and create minimal entities
    sessionData.userIds.forEach(userId => {
        db.exec(`INSERT INTO users (id, email) VALUES ('${userId}', 'test-${userId}@example.com')`);
    });

    sessionData.orderIds.forEach(orderId => {
        db.exec(`INSERT INTO orders (id, user_id, status) VALUES ('${orderId}', '${sessionData.userIds[0]}', 'pending')`);
    });
}
ID Mapping
ID mapping happens during transformation (Part 2), so transformed traffic already has test IDs. By leveraging recorded traffic, accurate ID mapping ensures that replayed sessions closely mirror real-world scenarios. At replay time, you just use them as-is.
Mixing Production and Local Traffic
Combine production traffic with locally captured traffic to test both existing patterns and new code paths. The ability to capture traffic from both production and local environments enables comprehensive testing by replicating real-world user interactions for more accurate performance analysis and troubleshooting:
# Capture production traffic (Part 1)
./capture-prod-traffic --output ./prod-traffic/

# Run your service locally with proxymock
proxymock record --app-port 8080 --out ./local-traffic/

# Exercise new endpoints manually
curl http://localhost:4143/new-endpoint

# Replay combined traffic
./replay --traffic ./prod-traffic/,./local-traffic/ --target http://localhost:8080
This gives you:
- Production coverage: Real user patterns, edge cases, load characteristics
- New feature coverage: Locally captured traffic for endpoints that don’t exist in production yet
Scaling Replay
Parallel Execution
k6 handles parallelization automatically with Virtual Users (VUs). Each VU runs your script concurrently:
# Run 10 concurrent replay sessions
k6 run --vus 10 --duration 30s replay-script.js
Replay Speed Control
Replay faster than real-time to speed up tests:
// Replay at 10x speed
const delay = (req.timestamp - baseline) / 1000;
sleep(delay / 10.0);
Result Aggregation
k6 automatically aggregates results. Add custom metrics for tracking:
import { Counter } from 'k6/metrics';

const passed = new Counter('replay_passed');
const failed = new Counter('replay_failed');

export default function() {
    capturedRequests.forEach(req => {
        const response = http.post(req.url, req.body);
        const valid = check(response, {
            'status matches': (r) => r.status === req.expectedStatus
        });

        if (valid) {
            passed.add(1);
        } else {
            failed.add(1);
            console.error(`FAIL: ${req.url} - expected ${req.expectedStatus}, got ${response.status}`);
        }
    });
}
After the run, k6 outputs summary statistics:
replay_passed...........: 1247  41.5/s
replay_failed...........: 3     0.1/s
When to Use What
| Approach | Use When | Avoid When |
|---|---|---|
| Direct Replay | Stateless services, read-only endpoints | Complex state, many dependencies |
| Shadow Traffic | Performance testing, production validation | Database writes, need response validation |
| Replay with Mocks | Integration testing, CI/CD, most scenarios | Early development (no traffic yet) |
Recommended flow:
- Capture production traffic continuously (Part 1)
- Transform for reusability (Part 2)
- Replay with mocking in CI/CD
- Shadow traffic for final production validation
Tools
| Tool | Approach | Best For |
|---|---|---|
| k6 | Load testing with JavaScript | Performance testing, replay scripts |
| WireMock | HTTP mocking | Dependency mocking, API stubs |
| Speedscale | K8s-native replay + auto-mocking | Microservices, load testing |
| GoReplay | HTTP replay/shadowing | Simple HTTP replay |
| Diffy | Comparative replay | Regression detection |
| proxymock | Local traffic capture + replay | Development, CI/CD |
Conclusion
Traffic replay is a big data problem: you have tons of captured traffic, storage is cheap, so use it. Store everything (Part 1), identify what changes (Part 2), then replay against new code with selective mocking.
The key is mixing production traffic with local traffic. Production gives you real patterns and edge cases. Local traffic from proxymock covers new endpoints and features. Together they validate both existing behavior and new code paths.
Start with replay + mocking—it’s the goldilocks zone. Shadow traffic is fast but risky. Direct replay is simple but limited. Build the six core components (store, orchestrator, transformer, mock manager, validator, reporter) and iterate.
Next steps:
- Review Part 1: Traffic Capture
- Review Part 2: Traffic Transform
- Try proxymock for local capture and replay
- Join our Community to discuss traffic replay
If you want a production-ready solution, check out Speedscale—it handles capture, transform, and replay with automatic mocking for Kubernetes.