Beware of PII in Testing Data: The Security Iceberg and Where PII Actually Hides
If you run a platform tools or security team, you have likely heard this request from developers: “I just need a copy of the production database for staging so I can run realistic load and integration tests.”
It is a completely reasonable request. Production traffic and data contain the actual request shapes, real-world value distributions, long-tail anomalies, and timing patterns that make tests useful. Synthetic data and hardcoded fixtures confirm that your software works in theory, not that it survives contact with the real world.
But the answer is almost always a firm “No.”
This creates what we call the close-enough trap. To satisfy developers, teams try to curate “production-similar” datasets by copying database snapshots, running static scripting tools to scrub names and emails, and provisioning them to staging.
This is a security illusion. If your test data is similar enough to production to be useful, it is often similar enough to leak or be re-identified. And as distributed architectures and event-driven APIs evolve, personally identifiable information (PII) is no longer confined to neat database columns. It hides in places your static masking scripts will never find.
In this post, we’ll explore the security iceberg of “production-similar” data, pinpoint exactly where hidden PII lurks in modern API streams, cover infrastructure-level DLP, and finish with a step-by-step walkthrough using proxymock to discover and redact sensitive data locally.
The “Close-Enough” Paradox: The Illusion of Safe Test Data
Why does “production-similar” data fail? It comes down to a fundamental trade-off:
- If you mask too heavily: You destroy payload sizes, real-world value distributions, state dependencies, and timing patterns, rendering your performance and integration tests useless.
- If you mask too lightly: You violate GDPR, HIPAA, and CPRA.
Even worse, you face the Mosaic Effect. This is the phenomenon where combining several seemingly anonymous, “production-similar” data fields allows for unique re-identification. For example, researchers have demonstrated that combining just three non-PII fields—zip_code, gender, and birth_date—uniquely identifies roughly 87% of the US population.
When you clone a database and simply scrub the name and email columns, you aren’t creating safe test data. You are creating a regulatory liability.
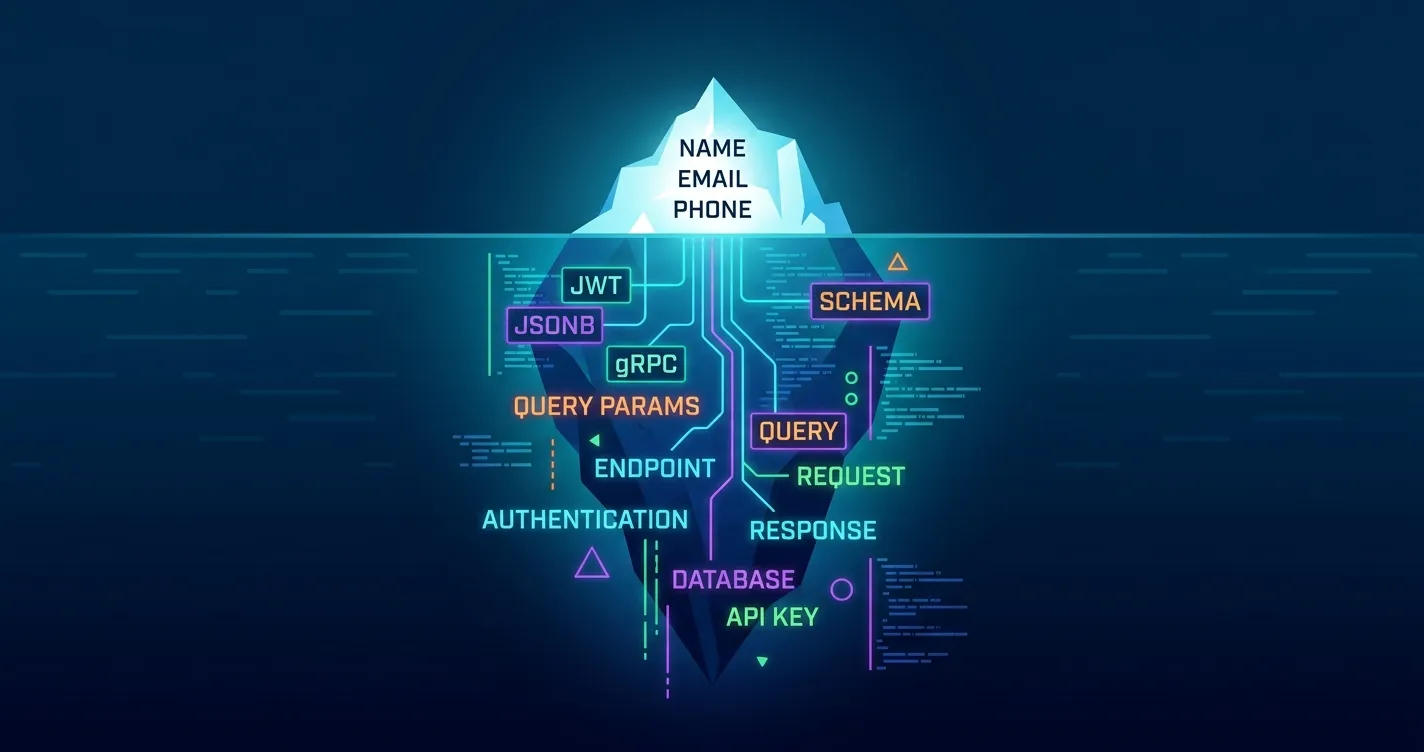
The Security Iceberg: 5 Places Hidden PII Lurks in Modern APIs
Traditional Test Data Management (TDM) tools were built for monolithic architectures with predictable SQL tables. In modern cloud-native systems, microservices integrate with dozens of third-party APIs and exchange rich, nested payloads.
PII is highly transient and hides deep within the network layer:
                  ▲  [The Obvious PII]
                 / \  - Email Columns, SSN, Phone Numbers
                /   \
  ═════════════/═════\═════════════════════════════════ Water Line (Static DB Scanners)
              /   ░░  \
             /  ░░░░░  \  [The Security Iceberg: Hidden PII]
            /  JWT Claims\ - Encoded custom claims
           /   JSONB Blobs\ - Schemaless unstructured nested arrays
          /  gRPC/Protobuf \ - Opaque binary streams
         /   GET Query Params\ - Leftover session/PII in logs
        /  Exception Dumps    \ - Raw memory stack traces
       └───────────────────────┘
1. Unstructured JSON/JSONB Blobs
Modern microservices frequently dump schemaless JSON data into document stores (like MongoDB) or PostgreSQL jsonb fields. These fields undergo rapid schema evolution. While a database scanner might look for a top-level email column, it will completely miss an email nested three layers deep inside an unstructured, historical JSON blob.
2. JWT Claims and Auth Headers
JSON Web Tokens (JWTs) inside authorization headers appear to be opaque strings of random characters. But JWTs are simply base64-encoded JSON objects. They frequently contain custom claims, internal user IDs, company roles, or tenant IDs. Anyone who intercepts a staging payload can decode these headers instantly.
3. GET Query Parameters
Legacy integrations and web hooks often pass emails, session IDs, or phone numbers inside URL query parameters (e.g., /user/verify?email=user@example.com). These URLs are automatically logged by reverse proxies, API gateways, and application performance monitoring (APM) tools, leaving a trail of unmasked PII across your entire observability stack.
4. Binary gRPC and Protobuf Payloads
High-performance microservices communicate using binary protocols like gRPC and Protocol Buffers. Because this traffic is not human-readable text, many security scanners and static proxies ignore it. However, if an attacker decrypts a gRPC stream or accesses a dumped binary payload, the original PII remains fully reconstructible.
5. Exception Stack Traces
When an application encounters an unhandled error, it often dumps the entire active memory context—including active user sessions, raw SQL query payloads, or request bodies—into its stack trace. These traces are forwarded directly to centralized logging tools (like Elasticsearch, Splunk, or Datadog) where they sit completely unredacted.
Taking Control: Scalable DLP Across Your Infrastructure
To prevent regulatory catastrophes, you need a policy-driven, infrastructure-level safeguard.
You cannot rely on manual database scrubbing or hope that developers remember to write local regex filters. You need a streaming, zero-trust approach where DLP happens automatically inside the cluster boundary before any data ever leaves your network.
flowchart TD
    subgraph TraditionalTDM["Traditional DB Cloning (The Close-Enough Trap)"]
        A[Production DB] -->|Nightly Snapshot| B[Cloned DB]
        B -->|Scrub 'name' & 'email' columns| C[Masked DB]
        C -->|Provision DB Snapshot| D[Staging App]
        style TraditionalTDM fill:#fef2f2,stroke:#f87171
    end

    subgraph HiddenPII["Hidden PII leaks through transit layers"]
        D -->|Missed JSONB blobs| E[Staging Logs]
        D -->|Decoded base64 JWTs| E
        D -->|APM Query params GET| E
        D -->|Opaque gRPC binary streams| E
        style HiddenPII fill:#fffbeb,stroke:#fbbf24
    end

    subgraph DynamicTraffic["Speedscale Dynamic DLP"]
        P[Production API Traffic] -->|eBPF / Sidecar| F[In-Cluster Forwarder]
        F -->|Real-time streaming DLP| G[PII-Redacted Snapshot]
        G -->|Dynamic Mock Replay| H[Safe Local Dev/Staging]
        style DynamicTraffic fill:#f0fdf4,stroke:#4ade80
    end
Speedscale’s in-cluster forwarder intercepts production API traffic, automatically redacting and replacing sensitive PII (like credit card numbers, JWT claims, and emails) with harmless REDACTED- tokens before they are recorded or saved.
This ensures you can always feed your pre-production staging environments and AI coding assistants with high-fidelity, structurally accurate traffic—without ever accepting production risk.
To learn how to configure streaming Data Loss Prevention and automatically mask sensitive traffic for your entire team, check out the Speedscale DLP Documentation.
How-To: Spotting Hidden PII Local-First with Proxymock
Want to try this on your own machine before rolling out infrastructure-wide controls? Speedscale’s proxymock is a local-first record, replay, and mocking tool that lets you capture real API traffic and spot dynamic patterns—including hidden PII and secrets—right from your workstation.
Let’s walk through how to install proxymock, record sample traffic from a demo application, and use its built-in automated recommendation engine to detect sensitive data.
Step 1: Install proxymock
On macOS, you can install proxymock quickly via Homebrew:
brew install speedscale/tap/proxymock(On Linux, run: sh -c "$(curl -Lfs https://downloads.speedscale.com/proxymock/install-proxymock)")
Once installed, initialize your workspace with:
proxymock initThis will open your browser and authenticate your local installation securely.
Step 2: Record Sample API Traffic
We’ll use the open-source Go demo application outerspace-go to capture realistic API traffic. This service accepts incoming user queries and calls downstream APIs.
Clone the repository and start a recording session under proxymock:
# Clone the demo app
git clone https://github.com/speedscale/demo
cd demo/node-auth

# Record inbound and outbound traffic
proxymock record -- npm start
proxymock is now intercepting inbound traffic on port 4143 and forwarding it to the Go application running on port 8080.
Open a new terminal window and run the test suite to simulate real API traffic through the application:
cd demo/node-auth
./client/test.sh 4143
These tests generate normal HTTP transactions. Once they pass, return to your original terminal and press Ctrl-C to stop the recording. Your captured traffic is saved locally to the proxymock/ directory as markdown files.
Step 3: Run Automations & Spot PII
proxymock includes a web-based local dashboard that allows you to analyze your traffic and run powerful one-click automations.
Launch the local web UI from your terminal:
proxymock webThis starts a local server and opens your browser to the Requests view.
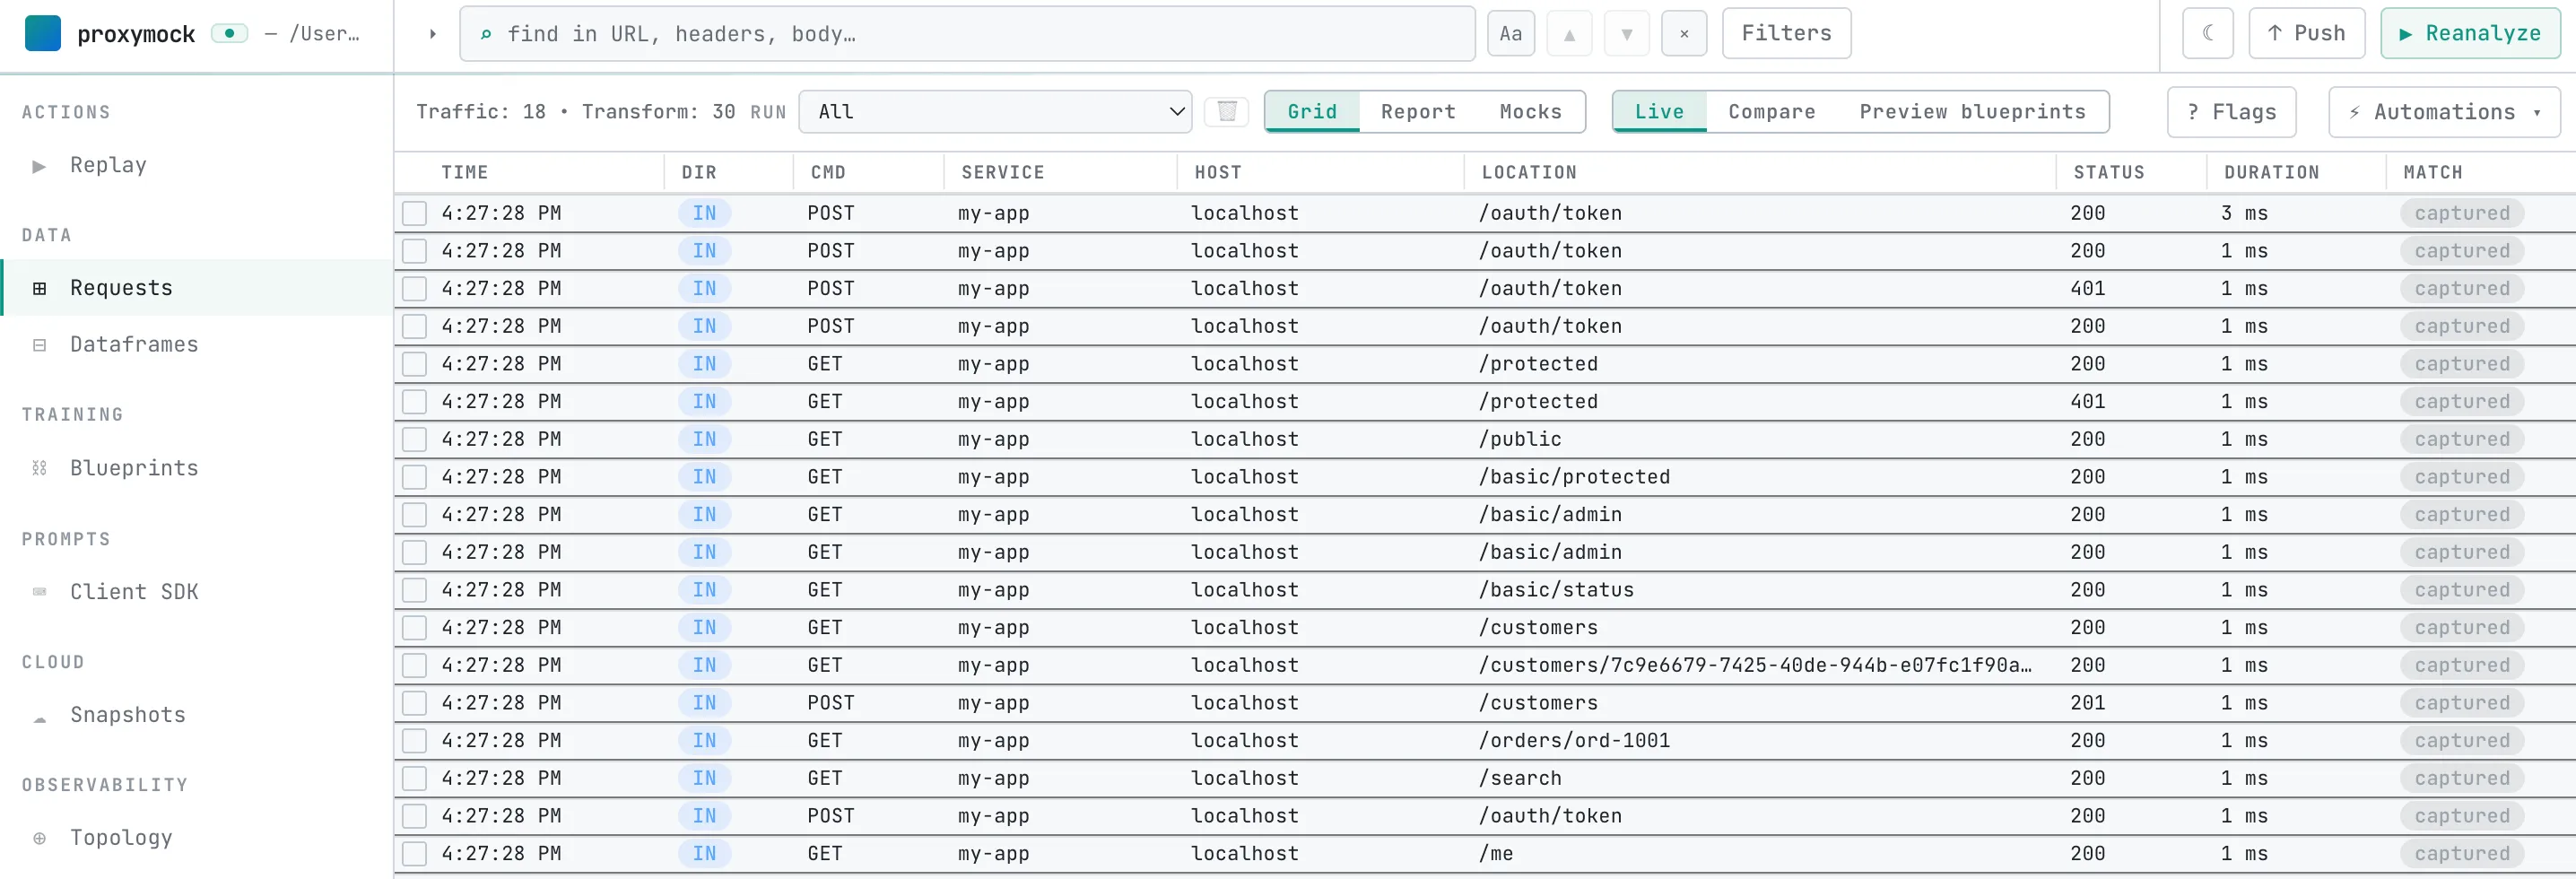
- In the top-right corner of the Requests view, click the ⚡ Automations button.
- The automation engine scans your recorded request payloads, headers, and query parameters, matching them against known dynamic formats (such as JWTs, basic auth credentials, or session IDs).
- Click Next through the interactive wizard to view the findings.
- As you navigate through the wizard, the engine highlights sensitive information discovered in the demo app—including JWT authorizations, emails, and exposed API credentials.
Accepting these recommendations automatically writes local blueprints (JSON transform configurations in proxymock/blueprints/) that substitute or strip these values on subsequent local replays.