Replicate Production Traffic: Record in 1 Environment, Replay in Another
Have you ever experienced the problem where your code is broken in production, but everything runs correctly in your dev environment? This can be really challenging because you have limited information once something is in production, and you can’t easily make changes and try different code. Speedscale production traffic replication lets you securely capture the production application traffic, normalize the data, and replay it directly in your dev environment.
There are a lot of challenges with trying to replicate the production environment in non-prod:
- Data - Production has much more data and a much wider variety than non-prod
- Third Parties - It’s not always possible to integrate non-prod with third party sandboxes
- Scale - The scale of non-prod environment is typically just a fraction of production
By using production traffic replication, you can bring the realistic data and scale from production back into the non-prod dev and staging environments. Like any good process implementing Speedscale boils down to 3 simple steps:
- Record - utilize the Speedscale sidecar to capture traffic
- Analyze - identify the exact set of calls you want to replicate from prod into dev
- Replay - utilize the Speedscale operator to run the traffic against your dev cluster
“Works on my machine” -Henry Ford (not a real quote)
Record
In order to capture traffic from your production cluster, you’re going to want to install the operator (helm chart is usually the preferred method). During the installation, don’t forget to configure the Data Loss Prevention (DLP) to identify sensitive fields you want to mask, a good example is the HTTP Authentication header. Configuring DLP is as easy as these settings in your values.yaml file:
Data Loss Prevention settings.
dlp: enabled: true config: “standard”
Once you have the operator installed, then annotate the workload you’d like to record, for example if you have an nginx deployment, you can run something like this (or the GitOps equivalent if you prefer):
kubectl annotate deployment nginx sidecar.speedscale.com/inject="true"Check and make sure your pod got the sidecar added, you should see an additional container.
⚡ Note there are additional configuration options as needed for more complex use cases.
Analyze
Now that you have the sidecar, you should see the service show up in Speedscale. At a glance you’re able to see how much traffic your service is handling, and what are the real backend systems it relies upon. For example our service needs data in DynamoDB and real connections to Stripe and Plaid to work. In a corporate dev environment this kind of access may not be properly configured. Fortunately with Speedscale, we will be able to replicate even these third-party APIs into our dev cluster.
[caption id=“attachment_14980” align=“alignnone” width=“954”]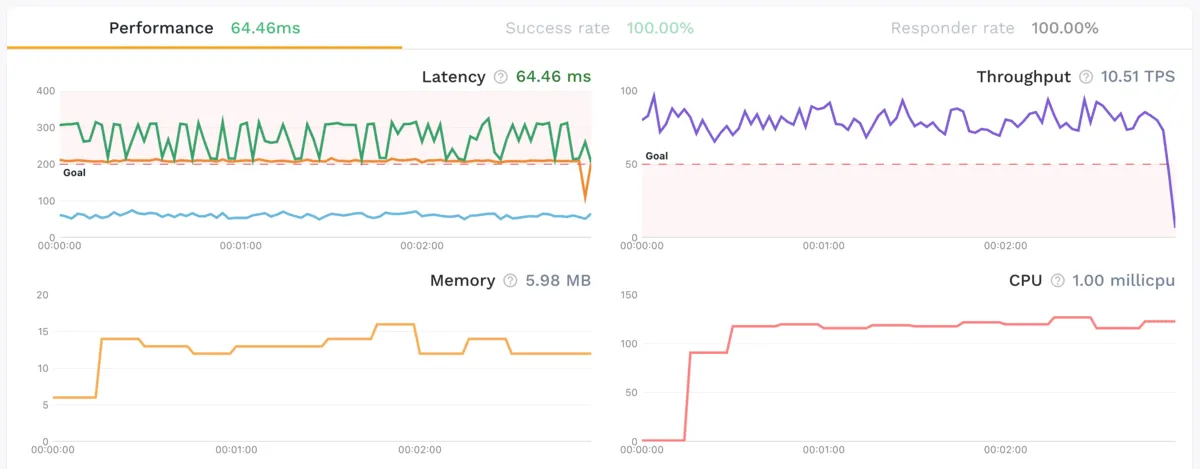 Browse service endpoints for production traffic replication[/caption]
Drilling down further into the data you can see all the details of the calls, including the fact that the Authorization data has been redacted. There is a ton of data available, and it’s totally secure.
[caption id=“attachment_14981” align=“alignnone” width=“959”] Browse PII redacted message payloads for troubleshooting[/caption]
Set the right time range for your data and add some filters to make sure you include just the traffic that you want to replay. Finally hit the Record button to complete the analysis.
[caption id=“attachment_14982” align=“alignnone” width=“948”] Apply filters to drill down into desired traffic[/caption]
Replay
Just like during the record step, you will want to make sure the Speedscale operator is installed in your dev cluster. You can use the same helm chart install as previous, but remember to give your cluster a new name like dev-cluster or whatever is your favorite name.
The wizard lets you pick and choose which ingress and egress services you want to replay in your dev cluster. This is how you’ll solve the problem for not having the right data in DynamoDB, or how to provide the Stripe and Plaid responses even if you don’t have it configured in the dev cluster.
[caption id=“attachment_14983” align=“alignnone” width=“877”] Choose endpoints for mocking[/caption]
Finally you can take the traffic you’ve selected and replay it locally in your non-prod dev cluster. Speedscale takes care of normalizing the traffic and modifying the workload so that a full production simulation takes place. The code you have running will behave just the same way it does under production conditions because the same kinds of API traffic and data are being used.
[caption id=“attachment_14984” align=“alignnone” width=“381”] Choose cluster for production traffic replication[/caption]
When the traffic replay is complete, you’ll get a nice report to understand how the traffic behaved in your dev cluster, you can even change configurations and easily replay this traffic again.

Conclusion
You now have the ability to replay this traffic in any environment where you need it: development clusters, CI/CD systems, staging or user acceptance environments. production traffic replication lets you re-create production conditions, run experiments, validate code fixes, and have much higher confidence before pushing these fixes to production. This allows fast, automated confirmation of changes, and can even be leveraged to generate load (by multiplying traffic) or simulating layer 7 chaos (by altering traffic patterns, response times, and injecting 404’s or 500’s). If you are interested in validating this for yourself, feel free to run your own replay today with a free trial account.