Don't Just Monitor SLAs - Validate Them Automatically
Service level agreements (SLAs) are the contractual backbone between customers and technology vendors, outlining expected service availability, performance metrics, and remedies like service credits when service providers fail to meet agreed-upon service levels. This service agreement assures both the technical quality as well as the service quality of the services provided, and underpins the value perspective of the client.
Traditionally, organizations rely on monitoring tools to alert on SLA violations and take reactive measures that detect problems after service failures occur. Historically, apm tools have played a key role in monitoring and tracking application performance, contributing to the ‘three pillars’ approach and paving the way for the evolution toward more open-ended, developer-centric observability. However, organizations often face challenges when implementing observability solutions in complex IT environments, such as dealing with diverse infrastructures and fragmented tools. But what if you could enforce SLAs proactively? Instead of using reactive measures, you could use proactive tools to ensure that you meet or even exceed our agreements, creating a system that allows you to measure performance, validate a proper baseline of functionality, and provide a better overall service. Observability and related data can significantly improve application performance by providing deeper insights into system behavior, troubleshooting, and optimization.
Speedscale enables continuous validation of service performance against contract baselines, ensuring that both the service provider and customer embed reliability into every deploy and validating SLAs across different environments. It’s a powerful solution to make sure that everything from securing customer data to ensuring uptime is measured and provisioned with effective service tracking, allowing you to maintain your customer happiness and your business position.

Today, we’re going to take a look at why SLAs are so vital in this space and how Speedscale can help you make the most of your systems. Let’s dive in!
Introduction to Observability
Observability is the cornerstone of modern system management, empowering teams to monitor, measure, and analyze the internal state of their systems by examining external outputs such as logs, metrics, and traces. This approach provides critical information that developers and engineering teams need to debug issues, optimize performance, and maintain robust system health. By leveraging observability data, teams can gain deep insights into how their systems behave in real time, enabling them to identify root causes of problems quickly and efficiently.
Observability tools play a vital role in this process, offering the ability to collect, visualize, and analyze data from across the entire stack. This not only streamlines the development process but also supports data-driven decisions that enhance customer experience and drive business outcomes. For engineering teams, observability is more than just monitoring—it’s about understanding the “why” behind system behavior, ensuring that every component is performing as expected, and proactively addressing issues before they impact users. By bringing observability into the heart of your development and operations workflows, you can transform how your teams monitor, debug, and optimize complex systems.
The Limitations of Reactive Service Level Agreement Monitoring
Most service providers and customer service providers depend on performance metrics and alerts when service levels drop below thresholds. While monitoring SLA violations is essential for disaster recovery and incident response, it suffers from some significant drawbacks:
- Delayed Response: Monitoring only signals missed deadlines or service failure after the fact, leading to customer dissatisfaction and potential third-party litigation costs.
- Manual Validation: Teams must manually compare logs and tracking data against the service level agreement, a time-consuming process prone to errors.
- Inconsistent Coverage: Monitoring tools often focus on uptime and error rates, ignoring nuanced business process metrics defined in technology vendor contracts or multi-level SLAs.
- Reactive Remediation: Customers may only regain service level credits after escalation procedures, forcing businesses to absorb costs and risk breach of customer expectations.
Traditional monitoring tooling, based on the ‘three pillars’ approach, often lacks the flexibility and integration found in modern observability tooling that supports proactive and open-ended investigations throughout the software development lifecycle.
Reactive SLA tracking leaves gaps between the notice period for service failures and the actual enforcement of SLA terms, harming customer satisfaction and business results. The gap between the expected service and the exact services delivered can lead to a significant decline in sentiment. It may also incur punitive financial penalties that extend beyond morale and market perception. Implementing end-to-end observability to close these gaps can be challenging, especially in complex IT environments with diverse technologies and infrastructure.
Benefits of Observability
Embracing observability delivers a wide range of benefits throughout the software development lifecycle. One of the most significant advantages is improved developer productivity—when teams have access to comprehensive telemetry data, they can quickly pinpoint root causes of issues, reducing the time spent on complex troubleshooting and minimizing production issues. Observability capabilities also enable teams to bring observability into their development process, allowing for a shift-left approach where potential problems are identified and addressed earlier in the lifecycle.
With real-time monitoring and analysis, teams can detect critical incidents as they happen, ensuring rapid response and improved system reliability. Observability provides a holistic view of system health by aggregating and correlating metrics, logs, and traces, giving developers and engineers the context they need to analyze and understand system behavior. This deep visibility not only supports root cause analysis but also empowers teams to make informed, data-driven decisions that enhance the reliability and performance of their software. Ultimately, observability helps organizations deliver better user experiences, reduce downtime, and maintain a competitive edge in today’s fast-paced digital landscape.
Proactive SLA Validation with Speedscale
The interesting thing about SLA metrics is that they are often fundamental system metrics. Availability, security, speed, all of these reflect critical internal components and their functional realities. For that reason, proactive SLA validation can be supported by implementing good metric tracking and system validation.
In other words, if you’re not tracking SLAs, you’re not just missing that boat - you’re missing some major systems tracking and observability.
Luckily, you can step up your game with Speedscale quite readily. With little overhead, Speedscale shifts SLA management from reactive monitoring to proactive validation by running continuous contract-based tests against your microservices and APIs. Development teams play a crucial role in implementing observability practices and maintaining SLA compliance throughout the application lifecycle. Key features include:
- Contract Baselines as Code: Define service level objectives (SLOs) and key performance indicators (KPIs) in version-controlled configurations, embedding SLAs directly into the development lifecycle.
- Automated Test Suites: Continuously run scenarios that measure service availability, API response times, error rates, and business logic outcomes to verify service levels before they reach production.
- Alerting and Escalation Hooks: Integrate with incident management systems to trigger escalation procedures or notify legal counsel if contract thresholds risk being breached.
- Long-term Capture for Validation: Capture traffic actively to boost your post-incident response and to validate you’ve actually met your SLA obligations, enabling service health and agreement alignment reviews.
- Infrastructure Validation: Validate SLAs across diverse infrastructure, including cloud and on-premises environments, ensuring compatibility and performance.
By capturing traffic and validating system behavior, Speedscale enables teams to analyze metrics, event logs, and traces to determine the root cause of SLA violations. This process also involves tracking transactions across microservices and infrastructure layers to identify issues and optimize performance.
By validating SLAs in staging and pre-production environments, teams ensure that the service provider’s performance aligns with customer-level SLAs and internal SLAs, avoiding surprises when software as a service deployments go live.
Key Components of Automated SLA Validation
To get automated SLA validation, you need to build out an automated metrics system that can both validate actively while collecting data for long-term review and calculation. Automated validation provides deep context for understanding system behavior and SLA compliance. This isn’t just about tracking uptime - it’s about codifying your entire service agreement into executable, testable logic.
When you automate SLA validation, you’re essentially transforming static contractual obligations into living, measurable metrics that evolve with your system. This shift ensures that every deployment, feature update, or architectural change is tested not just for functional correctness but for compliance with your business promises. Additionally, observability data provides valuable insight into system performance and reliability, enabling faster and more informed decision-making.
For long-term review and calculation, leveraging historical data allows you to improve predictive analytics and strategic planning, ensuring your SLA validation adapts to trends and recurring issues over time.
When automating SLA validation, it is crucial to implement efficient processes for troubleshooting and validation to optimize system performance and reliability.
To do this, you’ll need to do a few specific steps.
Baseline Definition
First, you’ll need to actually map out your service scope, agreement overview, and the appropriate behavior you expect to see from each service. This step is where your SLA moves from an abstract legal document to a precise, measurable set of service-level objectives (SLOs) and key performance indicators (KPIs).
Without a proper baseline, validation tests will lack context you can’t measure performance against an undefined goal.
You can do this by using Speedscale’s data collection process to capture active and ongoing data interactions, which should let you get a sense of how the system works in its base state. Real-world traffic patterns are invaluable for understanding what “normal” looks like, particularly for complex microservice architectures or multi-tenant SaaS environments. This will help you establish a few key metrics:
- Service availability (e.g., 99.9%) as determined by the incidence of unreachable endpoints or services. A baseline availability percentage allows you to predict how maintenance windows or unexpected outages affect contractual guarantees.
- Response time thresholds for protected resources measure the difference between the request and the actual response of the data in question. This includes not only average latency but also percentile metrics (p95, p99), which give a clearer picture of worst-case performance.
- Defect rates or error budgets, especially in relation to core endpoints abstracted from individual account or scenario errors that might be special or specific to a given configuration. By defining error budgets, you give your team a buffer for acceptable failure rates without triggering SLA penalties.
This baseline becomes a living reference point for future tests. It can be version-controlled, updated as your architecture evolves, and reviewed during regular SLA or vendor contract updates.
Performance Metrics
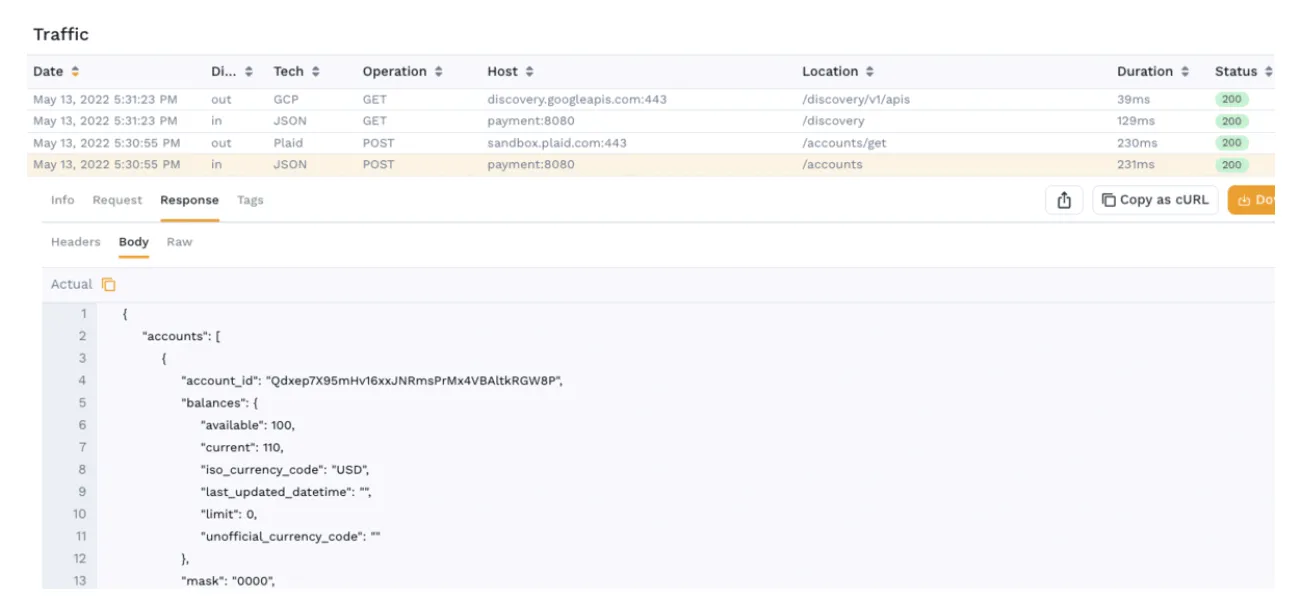
With a baseline measurement in place, you can start to use Speedscale to validate tracking systems while replaying existing traffic for better collection. Traditional synthetic tests often fail to capture real-world usage patterns.
With Speedscale, you can use captured production traffic to replicate real user journeys, including edge cases and high-load scenarios, ensuring your SLA validation tests are as close to reality as possible.
With existing data, you can repeatedly replay your data interactions to make sure that your systems are not only sound, they are accurate. Using Speedscale, you can capture HTTP requests and measure:
- API latency across multiple environments and workloads, verifying that response times stay within agreed thresholds during both normal and peak traffic conditions.
- Success and failure rates help to distinguish between transient network errors and systemic service issues.
- Business process metrics, such as transaction completion rates, are often overlooked but essential for SLAs that tie directly to business outcomes (e.g., payment processing success).
By continuously validating these performance metrics, you create an early-warning system that flags SLA risks before they impact customers.
Continuous Validation and Business Results
With your systems in place and your data collection validated, you need to ensure you are engaging in continuous validation to make sure your customer service level agreement is being met.
Continuous validation transforms SLA adherence from a periodic audit task into a real-time operational capability. Since you are actively capturing data already, you can do this in a few unique ways.
Firstly, you can embed tests into your CI/CD workflows for every deploy. Every time code is merged or deployed, automated SLA checks verify that no regression introduces performance degradation or availability risks. This means SLA compliance isn’t just a retrospective task but a core part of your DevOps pipeline.
You can also schedule periodic SLA stress tests - daily or weekly - to verify ongoing compliance. These tests can simulate failure scenarios, such as dependency timeouts or degraded services, ensuring that your system maintains SLA-level performance even under stress. Over time, this produces a reliable, historical record of SLA adherence that can be used for both auditing and strategic planning.
Reporting and Validation
With everything in place, you now need to ensure your reporting and auditing are working correctly. You can generate audit-ready reports with verification of service levels against monthly fees and service credits provisions, and take it a step further to provide visibility for stakeholders.
By giving this visibility to partners, both the service provider and external customers, you will demonstrate compliance with federal and state regulations and data privacy clauses.
Best Practices for Observability
To fully realize the value of observability, teams should adopt best practices that maximize the effectiveness of their observability tools and processes. Implementing distributed tracing is essential for tracking requests as they flow through complex, distributed systems, enabling teams to identify performance bottlenecks and optimize user experiences. Leveraging robust logging and monitoring tools provides continuous visibility into system health, while automation ensures that observability processes are consistent, repeatable, and scalable.
Defining clear goals and objectives for observability—such as improving system performance, reducing downtime, or enhancing customer satisfaction—helps teams focus their efforts and measure success. Incorporating AI-powered observability tools can uncover unknown unknowns, providing deeper insights and enabling proactive issue detection. Fostering a culture of observability within the organization is equally important; developers, engineers, and operations teams should collaborate closely to monitor, analyze, and optimize systems at every stage of the software development lifecycle.
By following these best practices, teams can unlock actionable insights, drive continuous improvement, and ensure their systems are resilient, reliable, and ready to meet the demands of modern users.
Case Study: SaaS Vendor Embeds SLA Validation
To get a sense of how Speedscale can implement customer-based SLA in practice, let’s look at an example implementation.
A leading software-as-a-service company faces disputes over service credits when customers experienced intermittent API errors. The parties involved had pre-defined service warranties, but the client had specific expectations across the multiple services they subscribed to.
Knowing that their system had multiple customers, multiple vendors, and key business metrics in play, they decided to implement Speedscale as a method of ensuring automated SLA validation and responding to issues such as the one they now faced.
When the company implemented Speedscale, they deployed a few systems to ensure automated SLA validation:
- They codified service performance baselines in a shared repository alongside their technology vendor contract.
- Automated test scenarios simulated both normal and burst traffic, measuring API error rates and response times against agreed thresholds.
- Tests ran on every pull request, blocking merges that introduced SLA violations and running full-scale validation nightly.
- Generated monthly SLA compliance reports, which streamlined billing adjustments for service credits and improved trust with enterprise customers.
The results?
- Data that can be used to prove SLA fundamnetals
- Enablement for dispute resolution through auditing reports
- Automated flags for failed systems in production, allowing for rapid response
By combining these approaches, not only can the vendor ensure that their customer SLA has been met and their internal service level agreement maintained, they can repeat these tests to validate ongoing data exchange, the efficacy of security measures, and tracking of potential network security breaches and responses.
In essence, the visibility enabled by Speedscale means an observability of SLA metrics, and regular maintenance schedules, reviews, and measurement tools implementing auditing reports allow for better visibility throughout the entire service.
Conclusion
Service level agreements are only as effective as their enforcement. Monitoring alone is reactive and delays remediation, often leaving teams scrambling to patch issues after customer trust has already eroded. By validating SLAs automatically with Speedscale, defining baselines as code, running continuous contract tests, and generating audit-ready reports based on actual captured data, you bake reliability, predictability, and transparency into every deploy.
This proactive approach not only ensures that you meet the letter of your agreements but also helps you exceed customer expectations by detecting potential violations before they impact real users. Automated SLA validation becomes a strategic advantage, transforming what was once a legal safety net into a driver of operational excellence and competitive differentiation.
With Speedscale, service tracking, uptime measurement, and performance assurance are no longer isolated tasks but integrated components of a robust DevOps pipeline.
Stop waiting for service failures; proactively ensure service delivery aligns with customer expectations, regain service level credits when needed, and maintain trust with managed services and cloud computing customers. You can get started with Speedscale today for free - simply sign up for a trial and get going!