
When building cloud-based applications, managing the infrastructure becomes a bigger challenge as you scale. Kubernetes brings order to the chaos, letting you control and automate the containers used to deploy your application. Debugging in the cloud presents further challenges, and the complexities of distributed applications make it hard for many debugging setups to keep pace. Tools designed to run locally aren’t effective. However, there are Kubernetes debugging services that can handle the shift in paradigm. In this article, you’ll read about several options that make debugging Kubernetes applications much easier.
Why Discuss These Tools
The tools in this list have been chosen mainly because of the capabilities they offer. They make debugging easier and deliver information that helps you solve problems.
They are also accessible and are easy to use and set up. In addition, they are generally open source and either free or inexpensive.
This article highlights just a few of the resources that are available, so please explore and check out the Kubernetes Documentation, along with all the other Kubernetes resources out there.
Kubernetes Debugging Tools
Following is a list of debugging services for Kubernetes. This list includes kubectl, Telepresence, Speedscale, Sonobuoy, and Grafana.
Also check out our Top 15 Kubernetes Resources
kubectl
kubectl is a client that lets you interact with the Kubernetes API from the command line tool.
It’s an essential starting point for managing any Kubernetes cluster, and mastering it is key if you want to get the most out of your container infrastructure.
Many of the commands it enables are relevant to debugging. They offer multiple ways to get information about your pods and clusters.
kubectl Debug
The initial kubectl command you’ll look at is debug. The kubectl debug node command only works with ephemeral containers, which requires Kubernetes v1.23 or later.
Ephemeral containers are designed for close inspection but have a few limitations, including not having ports. The Kubernetes Documentation explains how you can create an ephemeral container with a single kubectl run command:
kubectl run ephemeral-demo --image=k8s.gcr.io/pause:3.1 --restart=Never
You can add a debugging container using the following command:
kubectl debug -it ephemeral-demo --image=busybox:1.28 --target=ephemeral-demo
Then you can inspect the running pod using other commands, like describe, which is discussed next.
Using debug could hardly be quicker or easier. However, as previously stated, it only works on the latest versions of Kubernetes.
kubectl Describe
kubectl describe is simple and useful, making it essential to know. To get info on a pod, you can use the following command:
kubectl describe pod mypod
After running the previous command, you’ll get an output that’s packed with useful detailed information, such as the pod’s status, its priority, the ports it’s using, and the timing data showing when it started and how long it lasted before failing, if that’s relevant.
You can also see which phase it’s currently in.
kubectl exec
kubectl exec lets you open an interactive shell into the remote cluster from your local machine. This is helpful if your container image has debugging services.
kubectl exec -it mypod -- /bin/sh
Running /bin/sh will open a shell, but any command could be run. For example, to check your DNS service:
kubectl exec -it mypod -- nslookup kubernetes.default
kubectl Port-Forward
kubectl port-forward is a useful command for diagnosing issues with your network, load balancer, or pod IP. It lets you send traffic to a specific pod, so if the error is caused elsewhere, the error will no longer affect that specific pod.
To forward traffic to a specific pod, you can use the following command:
kubectl port-forward pod/your-pod-name 8080:5700
kubectl Bind the local port 8080 to the port 5700 of the container.
kubectl Get Events
Kubernetes events include errors and state changes, and being able to keep track of them is a big help when debugging Kubernetes apps.
The get events command helps you track them cluster-wide, giving you a broader overview than the more specific describe command.
It’s used via the following command:
kubectl get events
There are ways to sort the output, if you have a lot of it, by using flags, such as the following:
kubectl get events --sort-by='.lastTimestamp'
You can also wire this output up to monitoring tools, like Kubewatch or Eventrouter. These monitoring tools let you analyze the results in detail or get alerts if specific events occur.
kubectl logs
Logs let you view output from a target pod or target container inside your Kubernetes application.
kubectl logs mypod [-c mycontainer]
Telepresence
Telepresence lets you debug Kubernetes applications locally. You can configure your environment to work like your production environment, eliminating bugs that arise when they are different. You can even clone environment variables and bring them into a local IDE, like Visual Studio Code.
Once Telepresence is installed, you can start it easily by implementing the following command:
kubectl apply telepresence connect
You should initially receive a 401 response. After that, you can see what services are available via the following:
kubectl telepresence list
You can then get more details on any of the listed services:
kubectl get service your-service-name --output.yaml
And you can use the returned information to intercept its traffic, with the <code> replaced by the port you received in the earlier step and the </code>env-file parameter indicating where the remote configuration variables will be stored locally:
telepresence intercept your-service-name --port :http --env-file ~output/config.env
You’re now able to analyze traffic from the service. You can take a look at the Telepresence docs if you want more detailed information.
Telepresence is open source, and its documentation has several useful use cases and guides, though it can be a little too interactive at times (graying out future steps in guides, for example).
It’s a great way to debug in a safe environment that’s as consistent as possible with what you use for deployment.
Speedscale
Speedscale is a Kubernetes Traffic Replay platform that captures all incoming and outgoing requests. This means that in addition to seeing incoming traffic, you get to see the outgoing calls your Kubernetes application makes.
The Definitive Guide to Traffic Replay
Traffic replay is quickly gaining traction as the best way to recreate production scenarios.
You can install it from the command prompt by following the instructions on the Speedscale docs. Once it’s running, you can try installing a test app.
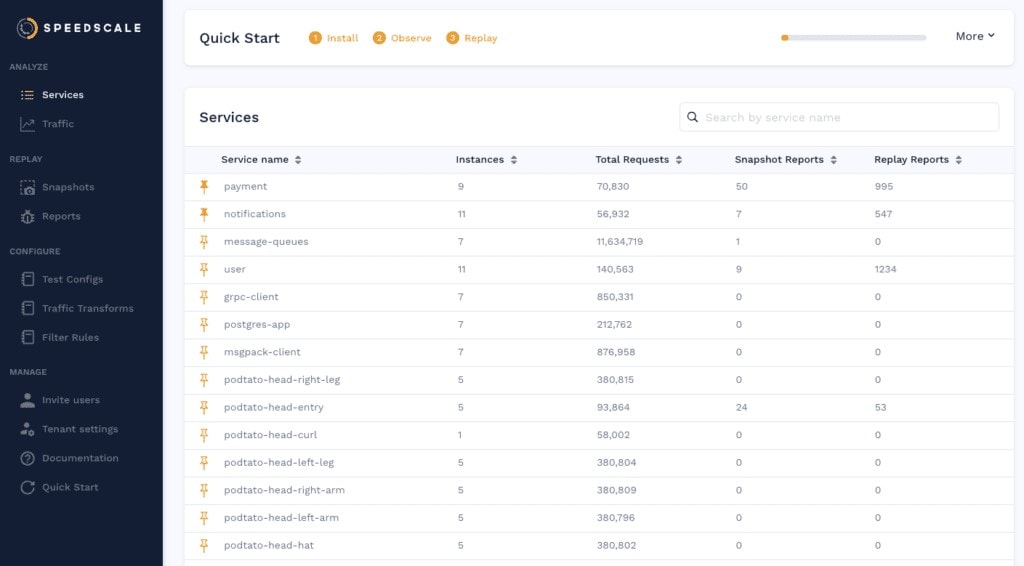
If you’re curious how the microservices are built, you can use Speedscale to intercept the calls and understand what is calling what. If you don’t have Speedscale already you can sign up for a Free Trial here. Once you have speedctl on your machine you can use it to install the control plane on your Kubernetes application:
speedctl install
Follow the default prompts to put the sidecar on everything in the default namespace:
✔ Deployments patched.
ℹ Patched default/podtato-head-right-arm
ℹ Patched default/podtato-head-hat
ℹ Patched default/podtato-head-left-leg
ℹ Patched default/podtato-head-left-arm
ℹ Patched default/podtato-head-right-leg
ℹ Patched default/podtato-head-entry
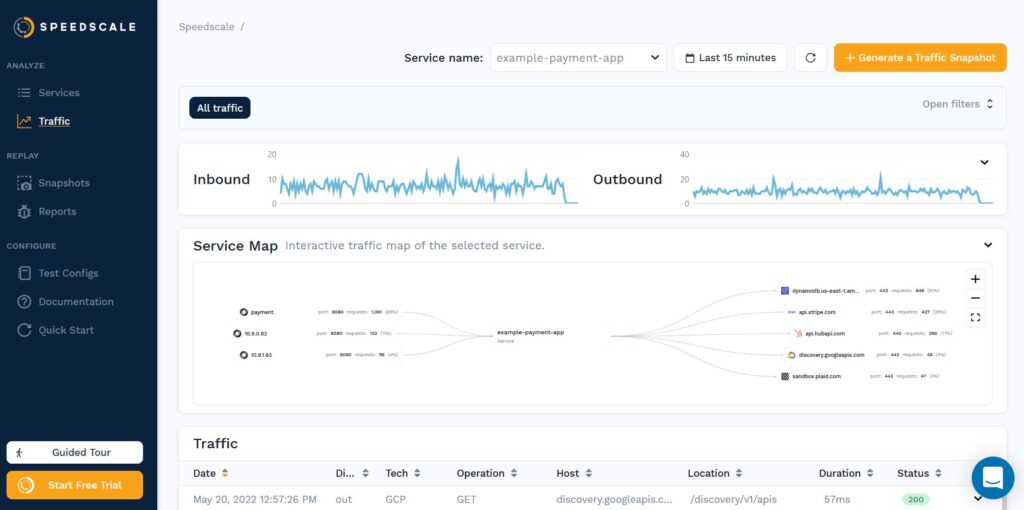
Once you exercise your application a little bit you should see the various services on your home page like so:
When you click into the podtato-head-entry you can see a map which shows the relationship of the various services. The entry service is responsible for fetching images from all of the other services which you can clearly see in the service map:
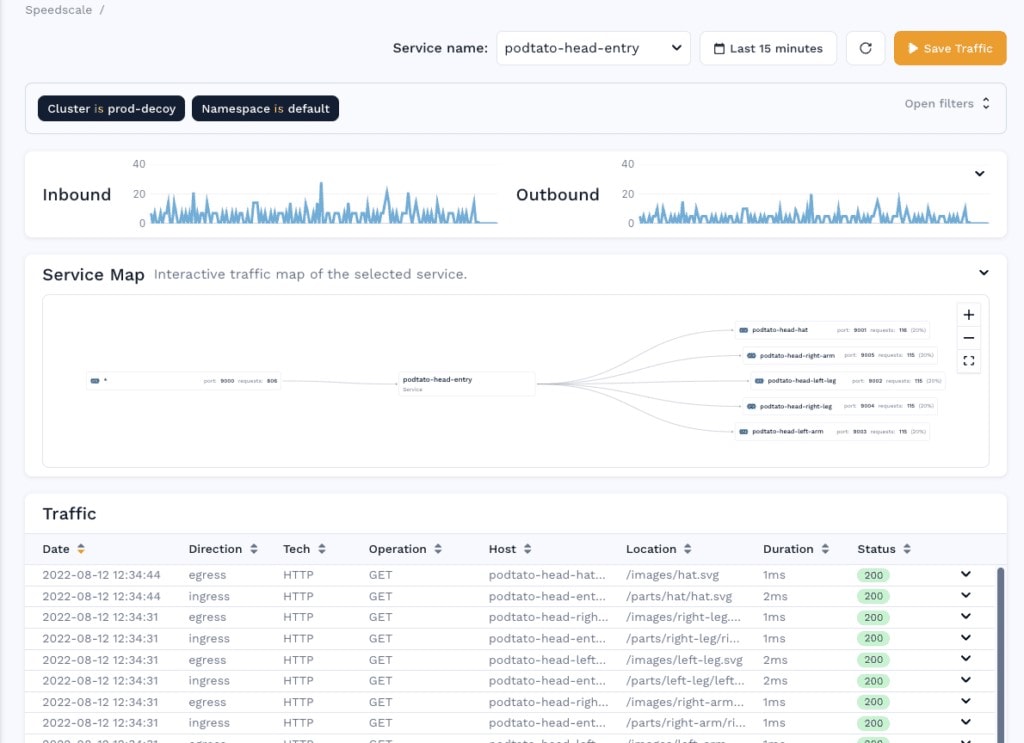
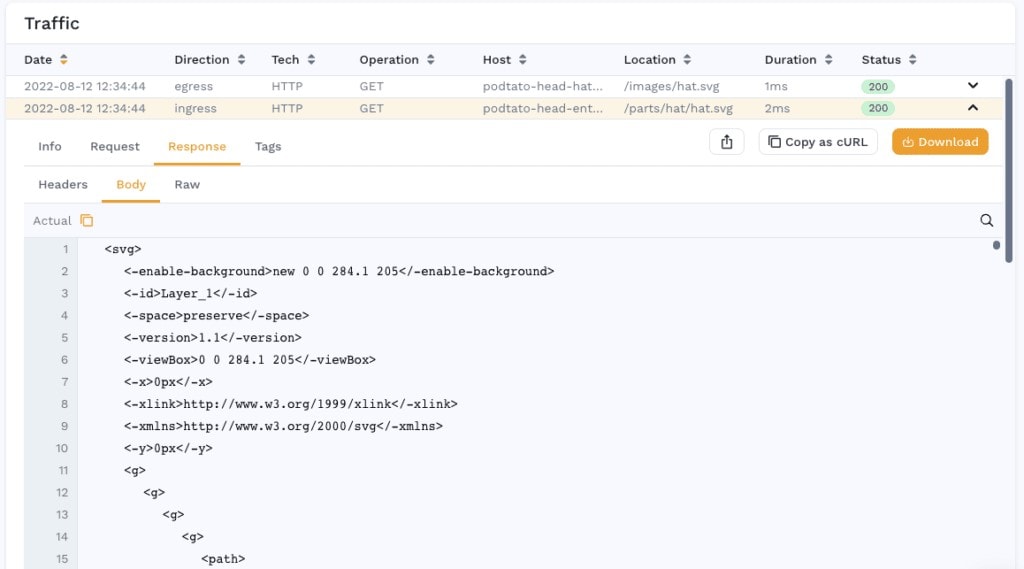
Going down into the table you can see exactly what the call is from the entry service to each outbound API, it’s actually fetching the SVG of the image that is shown on the home page.
By using this observed traffic, we ran replay as a load and performance scenario to understand the limits of our Kubernetes application. Click on the Snapshot button and this portion of traffic will be analyzed and stored for future use.
Now running a replay of that snapshot is as simple as applying a patch file. Note that this patch refers to the original traffic snapshot (yours will have a specific unique id), and it also references a test config to run through the traffic at 100x what was originally recorded.
apiVersion: apps/v1
kind: Deployment
Metadata:
name: podtato-head-entry
Annotations:
test.speedscale.com/scenarioid: UUID
test.speedscale.com/testconfigid: performance_100replicas
test.speedscale.com/cleanup: “true”
sidecar.speedscale.com/inject: “false”
Running the replay is as simple as:
kubectl patch deployment podtato-head-entry –patch-file patch.yaml
Sonobuoy
Sonobuoy is a diagnostic tool that lets you analyze your Kubernetes clusters. It supports conformance testing, supports workload debugging, and includes a variety of plug-ins for various use cases.
It’s open source and easy to get started with.
Once configured, you can run it easily with the following:
sonobuoy run –wait
This will run its conformance tests and wait for them to finish. You can then view the results with the following code, which will give you a list of any failed tests:
results = $(sonobuoy retrieve)
sonobuoy results $results
Sonobuoy is also a useful tool if you want to get your Kubernetes application certified.
Grafana
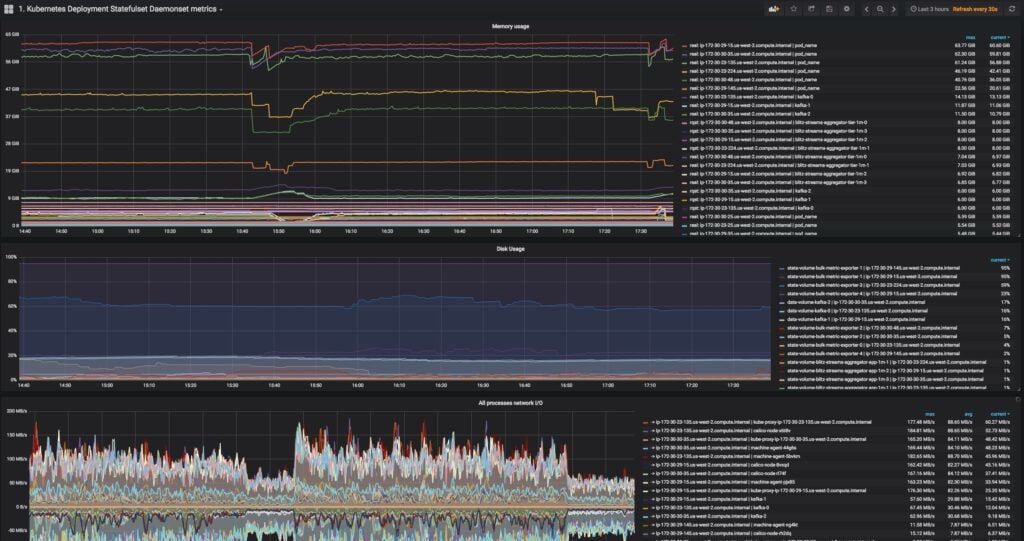
Grafana is a visualization system that lets you create displays using input from various sources. Its customizable dashboards are one of the most accessible ways to view data.
There are several boards available to pipe in Kubernetes data.
Grafana can use other tools as a source, making it a versatile way to monitor your infrastructure.
It also has a sandbox, so you can easily try it out. For at-a-glance debugging, it’s an invaluable tool.
K6
K6 is an open source load testing tool that you can use to test Kubernetes applications. It has a dedicated extension to help you. It also works with Speedscale, which has an integration of its own for doing just that.
Exporting your data from Speedscale is as simple as using the following code:
speedctl export k6
So you can collect data with Speedscale, and then use K6 to analyze the data.
Conclusion
Debugging distributed applications brings unique challenges. It’s harder to recreate specific environments and to fully capture all the information they generate. If you’re using Kubernetes, chances are you’ll run into issues that stop you in your tracks.
Fortunately, there are ways to make life easier. There are many tools to help debug Kubernetes apps. Having them in your armory leaves you better equipped to solve problems quickly and effectively.
If you want to make testing and debugging Kubernetes applications easier, Speedscale is worth checking out. Take a look at its test environment and learn what it can do for you.