Overview

Get started today
Replay past traffic, gain confidence in optimizations, and elevate performance.

Postman is a great tool for API testing during development. It’s GUI is simple to learn and ubiquitous. However, manually writing test cases for local development gets tedious fast if you have a lot of endpoints. Meticulously entering every detail for every use case takes forever. Also, if you get one HTTP Header or parameter wrong, it can take hours to diagnose. And even when it’s done, the API tests are almost immediately out of date because the API contract changes.

Fortunately, Speedscale’s free CLI tool can make your life much easier. With it, you can record requests and use them directly in Postman. It’s the best of both worlds: a slick UI and automated recording from a real application. If your API changes, just re-record and create a new collection. Also, you can take the same traffic recording and insert it into the CI build process when you’re done with your immediate development.

Read on to find out how to do this with the free Speedscale CLI tool and its Postman export feature.

1. Install Postman and the Speedscale CLI

Head on over to Postman’s download page if you don’t already have Postman installed. Install the Speedscale CLI using the instructions in the CLI repository:
				
					https://github.com/speedscale/speedscale-cli


2. Record traffic

For this demo tutorial, let’s use the pre-populated demo traffic that comes with the speedscale CLI. Eventually, you’ll want to record your own traffic. To help with that, use one of the pre-built guides in our documentation. When you’re done you should be able to view the traffic you’ve recorded in the CLI. For our demo application, you’ll see traffic like this if you run the inspect command:
				
					speedscale inspect demo


screenshot-1.png

3. Export collection

Make sure you’ve stopped capture and then export the data to Postman format:

				
					speedscale export postman ~/Downloads/demo_collection.json demo


If your traffic is recently captured you can exclude the snapshot ID at the end of this command (demo in this example). Take a look at the resultant Postman collection file (~Downloads/demo_collection.json). You should see one consolidated JSON file with your transaction information. For more information about Postman collections check out their website.

4. Import into Postman

postman import speedscale

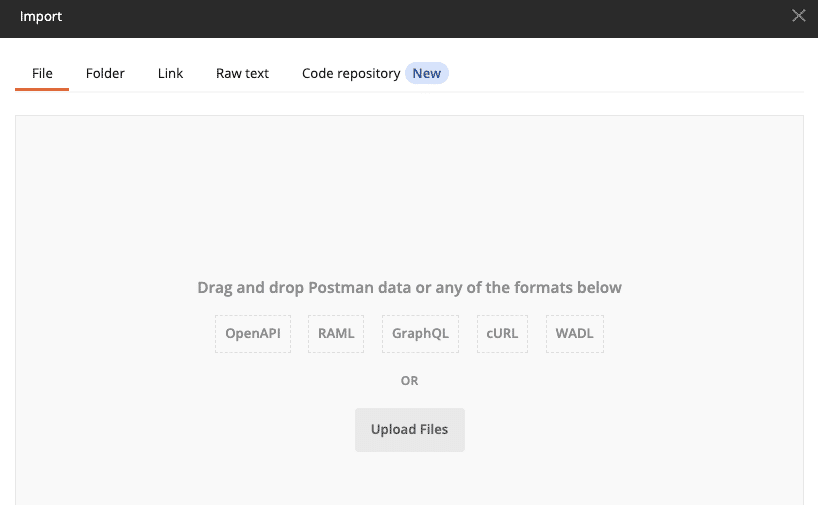
Click the import button and select the exported collection (~/Downloads/demo_collection.json in this example)
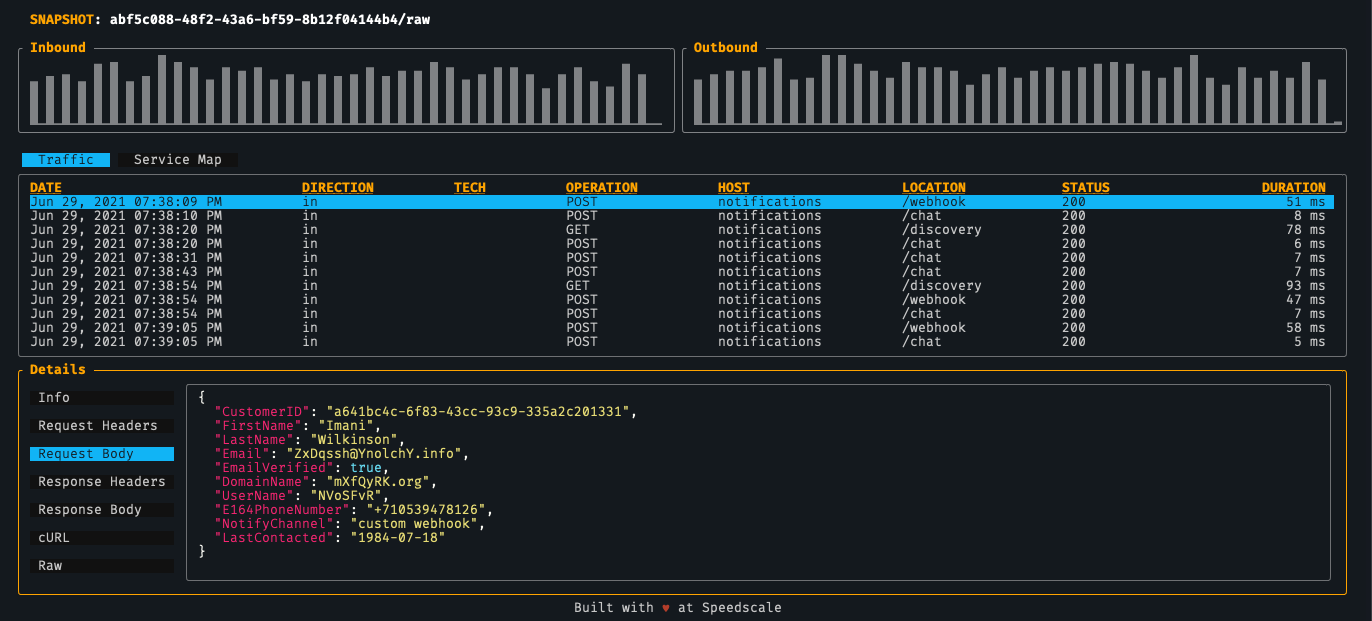
5. Inspect requests

Speedscale inspect requests

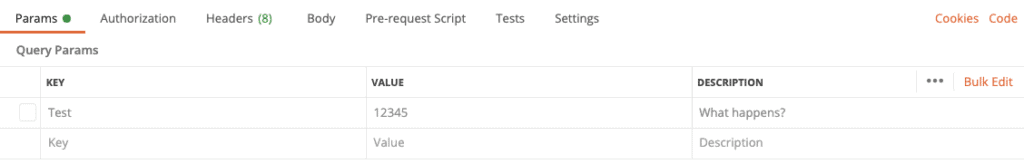
All of the recorded transactions should now be present in Postman. It’s that simple. Requests are grouped by host and include both the inbound and outbound requests from the service. This allows you to accomplish API testing on your service and the responses from its downstream APIs.

Further reading

Once traffic is recorded by Speedscale it can be used for a variety of purposes:

  • local API testing (like with this blog!)
  • periodic testing as part of the CI pipeline – check out our docs for Github, Gitlab, and Jenkins integration
  • automated load testing
  • automatic mocking of 3rd party dependencies like AWS or Google APIs

Feel free to re-use your recorded snapshot with our free or enterprise tools. Let us know if you have feedback on our Slack! Get started today with your own free trial!

Ensure performance of your Kubernetes apps at scale

Auto generate load tests, environments, and data with sanitized user traffic—and reduce manual effort by 80%
Start your free 30-day trial today