
Have you ever written a Hello, World! application? In most of these tutorials the first step is to log words to the console. It’s an easy way to understand what is going on with your application and readily available in every programming language. The console output is incredibly powerful, and it has become easier than ever to capture that output as logs. As your application grows and evolves you need to implement a structured application log approach. Here are some of the high level steps:
- Logging Library – There are simply too many libraries to list, and tons of options per language. At Speedscale for our golang apps we are using uber-og/zap, and have customized with additional context from every microservice. GitHub lists 500+ repositories in their #logging-library topic.
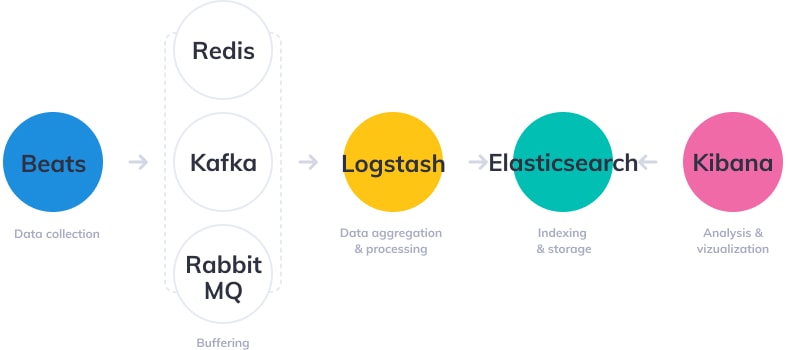
- Aggregate Multiple Sources – To capture logs from multiple locations there are services like fluentd, logstash, filebeat, etc. Similar to the libraries there are tons of open source options to collect logs and send them to the right outputs.
- Structured Logs – If you want to do things like separate
INFOfromDEBUG, and count how manyERRORmessages you have, then you need to implement structured logs so they can be processed centrally. This is where you begin making trade-offs about whether the logs are easier for a human or a machine to read. - Centralized Reporting – You may end up with pieces of code running in lots of places, so pulling logs into a central location can help.
- Cloud Vendor Logging Services AWS Cloudwatch, GCP Cloud Logging / Stackdriver, Azure Monitor Logs, etc.
- Open Source Log Databases Elastic Stack (formerly known as ELK), Grafana Loki, etc.
- Kubernetes health and event logging systems like ContainIQ, Komodor, etc.
- Practically all of the Observability vendors have a logging module, and there are standalone logging-only services. Again, too many to list here and I’d be sad if I left one out.
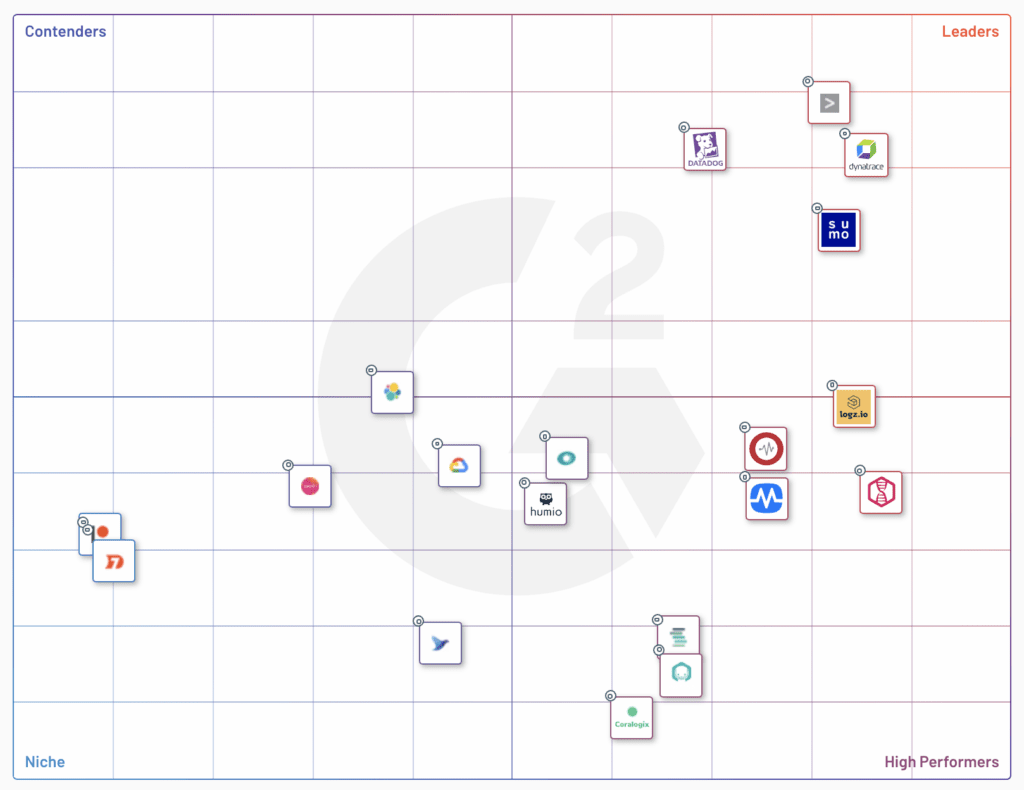
G2 has a comprehensive list of 20+ technologies in their G2 Log Analysis Grid.
Challenges of Logging
By the time you’ve started building out your logging system you may start to notice some cracks forming. While logs are super easy to get started, you will eventually start running into hurdles. Just like a lot of things in life, it starts out simple and can get complicated fast. Here are some of the gotchas to watch our for:
- You have to write the log statements, which means they can be done inconsistently
- Logs can easily grow out of control if you’re not careful
- Data processing for logs is pretty complex
- Each of the application components you use needs to have their logs tuned
- Implementing structured logs consistently is painful
You Must Write the Log Statements
Probably the biggest challenge of logging is that you are responsible for writing the log statements that may be read by other people. Will your co-workers who are reading the log data understand it the same way you meant it? And since everyone is unique, we may have differences of opinions about what is important to log. As time goes on it will become important to establish best practices that your team will adopt for what is appropriate to log.
Logs Can Grow Out of Control
We have seen cases in our own codebase where the logging is done slightly different in one component compared with another, and it can make it hard to track things down just by looking at logs. In addition, you can add log statements while debugging something in the dev environment, and these can get called thousands or millions of times in production. We had a case where our UI was refreshing the backend and our logs grew 50x in a matter of days.
Processing Log Data is Hard
As you move from Hello, World! to a distributed set of components, you need to collect these logs from all over the place. And while you are collecting them you want to normalize the data, and output to the correct locations. It turns out this can be pretty tricky, this detailed write-up from logz.io shows just how much goes into building your own log processing stack.
Tuning OOTB Logs
Every component in your stack probably does logging slightly differently. As you depend upon third party components you may be frustrated by what they consider to be INFO logs. Currently the system that produces the most logs for Speedscale is postgres because by default it’s logging every connection attempt. This fills up your logs with junk like this and takes extra time to tune the logging.
2021-07-27 12:44:11 UTC [17497]: [60ffff99.4459-3] speedscale@external-timescale,app=[unknown] [00000] LOG: disconnection: session time: 0:00:02.538 user=speedscale database=external-timescale host=192.168.1.217 port=40766
2021-07-27 12:44:11 UTC [17500]: [60ffff99.445c-3] speedscale@external-timescale,app=[unknown] [00000] LOG: disconnection: session time: 0:00:02.422 user=speedscale database=external-timescale host=192.168.1.217 port=57724
2021-07-27 12:44:11 UTC [17499]: [60ffff99.445b-3] speedscale@external-timescale,app=[unknown] [00000] LOG: disconnection: session time: 0:00:02.423 user=speedscale database=external-timescale host=192.168.1.217 port=28310
2021-07-27 12:44:11 UTC [17498]: [60ffff99.445a-4] speedscale@external-timescale,app=[unknown] [00000] LOG: disconnection: session time: 0:00:02.426 user=speedscale database=external-timescale host=192.168.1.217 port=30219
Note that the postgres output doesn’t include log level (INFO, DEBUG, ERROR, etc.). You will end up doing some kind of log tuning activity with each of your components.
Structured Logging is Tricky
Logs need additional context to understand more details. In our case common context we add to every log include:
- Timestamp – of course you need to know when something happened (btw – you have to decide on your format, we use ISO-8601)
- Service Identifier – if you have lots of services of course you want to segment logs by service with a friendly name, not a dynamic name like the pod name.
- Command Identifier – was it a certain verb like
GETorPOSTto a given URL like/v1/external/service? - Environment Metadata – what server, kubernetes cluster, namespace, deployment name, pod name, etc.
- Resource Metadata – if a lot is related to a replay, then we tag with the replay id and traffic snapshot id to make it easy to find these later.
- Format – we chose JSON for our format because it is easily ingested by elasticsearch as well as all of the major log vendors. On a local machine you can use
jqto easily pick out certain fields you care about.
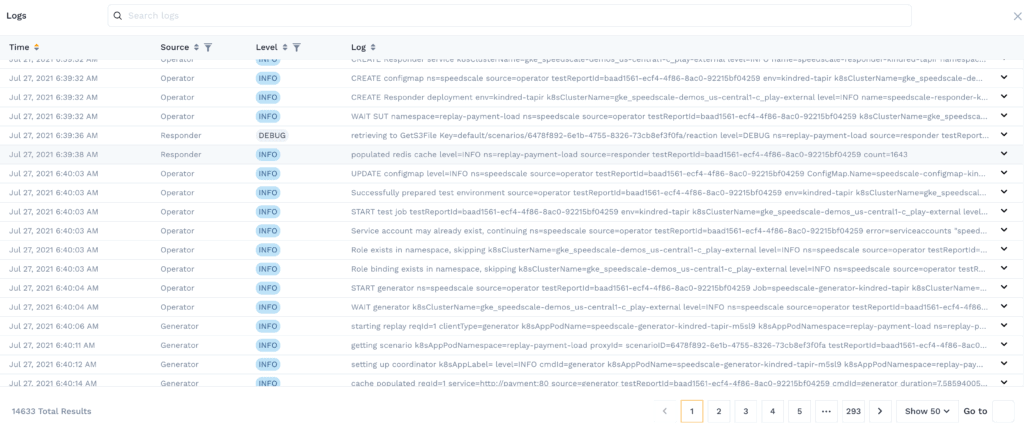
When you have this tuned really well you can see everything together like we show in this report. I’m able to see logs from the Operator, Responder and Generator which are all running in different pods. This is only possible because of the deep context we provide:
API Traffic as an Alternative to Logs
We are passionate at Speedscale about giving visibility into API Traffic between components. And one of our customer observations has been that we produce a really nice, structured message that includes a ton of data about your service. We call this an rrpair (request / response pair) and it has tons of useful information:
- Request – From the URL and host to the headers, authentication tokens and even the payload, we have deep visibility into the request
- Response – Not just a status code, but we have all the response headers and body as well
- Metadata – What cluster, deployment, pod, timestamp, response time, everything you want to know to group this request
Real Example with AWS DynamoDB
AWS is well-known for having multiple data storage options available, one of the popular ones being AWS DynamoDB. We implemented an example demo app that makes calls to Dynamo using the golang AWS SDK v2, and it can be hard to understand exactly what is going on under the hood. By drilling into the specific calls with Speedscale we can see an enormous amount of detail. Here is the exact code that was used in our app (note the connection was configured at initialization):
   // Check the tables
 resp, err := svc.ListTables(context.TODO(), &dynamodb.ListTablesInput{
     Limit: aws.Int32(5),
 })
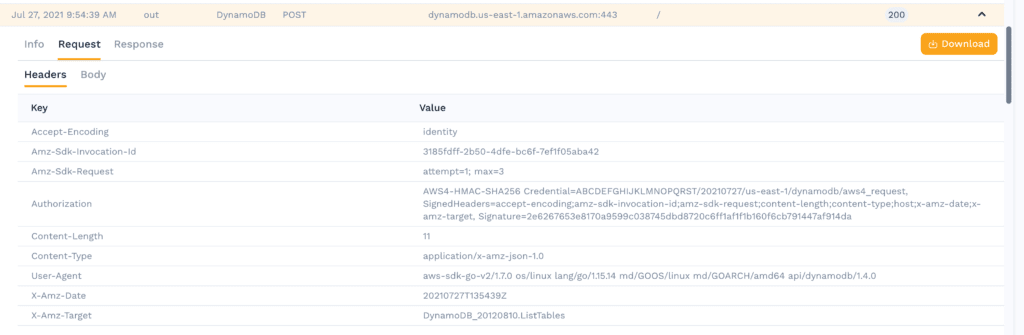
HTTP Request Headers
You can see the AWS Authorization header (modified to protect the innocent), user agent from the go SDK, and also the exact DynamoDB command of ListTables is set as a custom header as well.
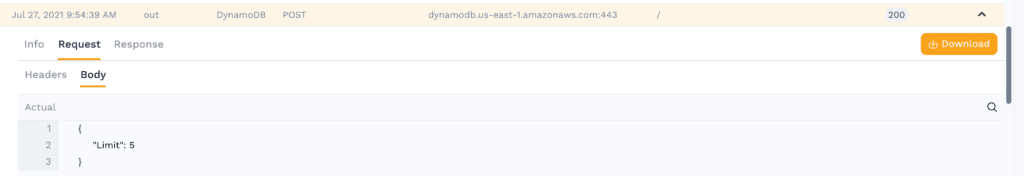
HTTP Request Body
This one is pretty simple just returning a single value. Because we set a limit of 5 in the call to the SDK this is all we see in the request payload.
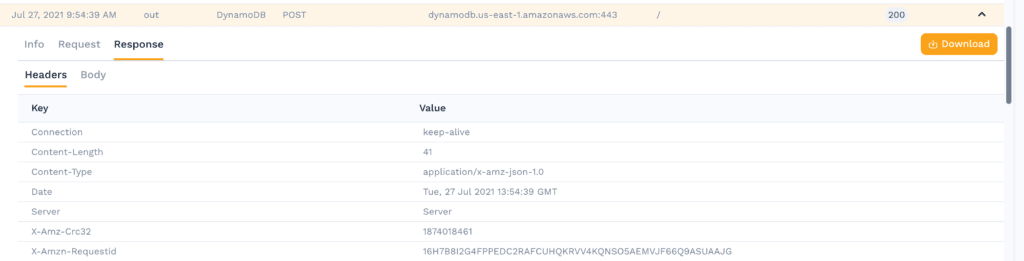
HTTP Response Headers
The response is pretty standard. It includes a CRC32 checksum and a request id to track the request on the AWS side.
HTTP Response Body
Again the response body is pretty simple for the ListTables command, it shows our 2 tables.
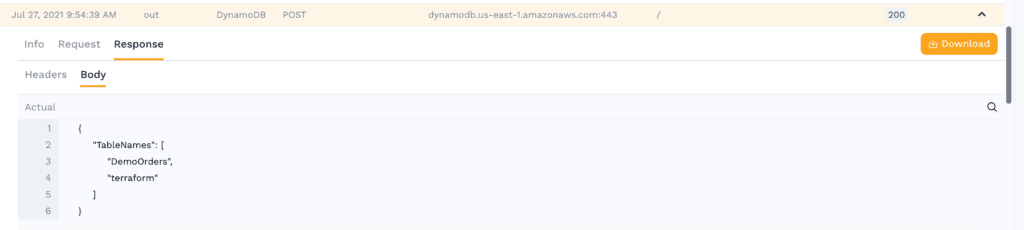
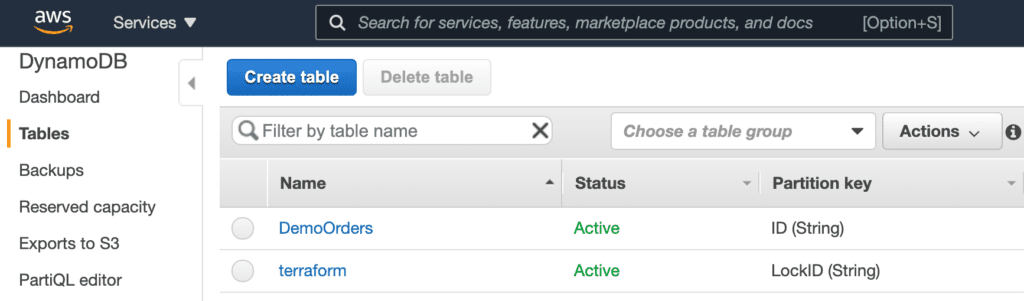
This of course matches what you see in the AWS console.
Using Speedscale
This type of API-centric visibility can be extremely useful when you haven’t had a chance to put logging in place, or are developing a new service. As connections to your API grows, being able to walk the transactions can accelerate debugging and quickly isolate issues for root-cause analysis. Imagine using API traffic for logs next time you’re running API tests, or in a war room trying to act on a hunch!
About Speedscale
Many businesses struggle to discover problems with their cloud services before they impact customers. For developers, writing tests is manual and time-intensive. Speedscale allows you to stress test your cloud services with real-world scenarios. Get confidence in your releases without testing slowing you down. If you would like more information, schedule a demo today!